POPULAR COURSES
Master Programs





Table of contents:
|
1. The Operational Execution
|
|
2. Why Choose Apponix? Engineering Analytical Competence |
|
3. The Final Insight |
Organizations are drowning in data but starving for strategic insights. In 2026, the ability to merely input numbers into a spreadsheet is entirely obsolete.
Employers demand technical professionals who can architect solutions, bridging the critical gap between raw information and executive decision-making. Mastering data analysis and Excel is the definitive baseline for this transformation.
However, transitioning from a basic software user to a strategic analyst requires moving far beyond simple arithmetic. This execution gap is exactly why our premier Data analytics course in Bangalore focuses exclusively on production-grade analytics.
Let's break down the top 12 analytical skills hiring managers actually test for in modern technical interviews.
The Operational Execution
1. Advanced Data Sanitization

In the real world, enterprise datasets are never clean. You will routinely encounter inconsistent categorical labels, null values, trailing spaces, and corrupted dates exported from legacy systems. Performing any statistical operation on unstructured data guarantees mathematically flawed financial reports.
Consequently, aggressive data cleaning remains the most critical analytical skill, consuming roughly 80% of an analyst's workflow. Employers expect you to utilize text functions (TRIM, PROPER, SUBSTITUTE), logic gates (ISNA, IFERROR), and duplicate removal protocols to sanitize inputs before a single visualization is built.
2. Relational Data Extraction

Corporate data does not live in one cohesive spreadsheet; it is highly fragmented. User acquisition metrics might sit in one workbook, while the corresponding sales revenue sits in a completely different table exported from a payment gateway. An analyst must synthesize these isolated data islands.
While modern functions like INDEX/MATCH and XLOOKUP are incredibly powerful, demonstrating a structural mastery of VLOOKUP is still a non-negotiable benchmark in technical interviews. It proves you understand relational logic, how to use a primary key (like a unique Customer ID) to extract and merge precise data points across massive datasets.
3. Multi-Dimensional Summarization
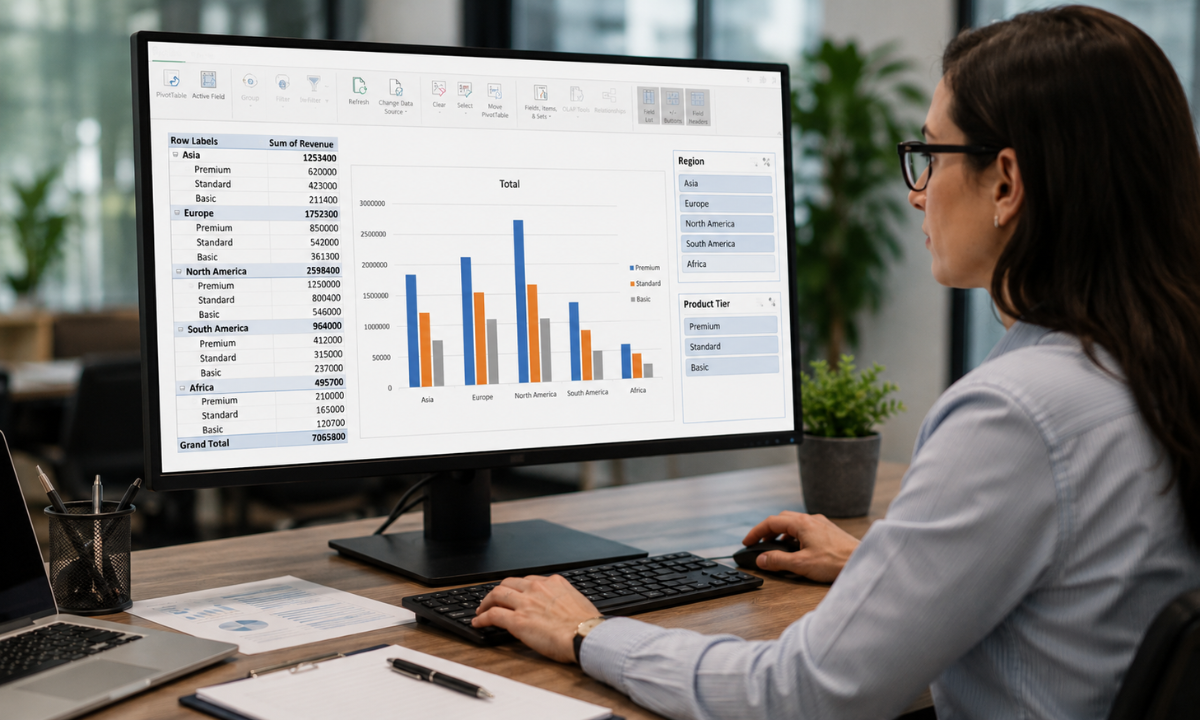
When a CFO asks for a breakdown of Q3 revenue across five different global regions categorized by product tier, they do not want to see 500,000 rows of raw transaction data. They require immediate, high-level summarization. Deploying a Pivot Table in Excel is the architectural solution to this problem. It allows an analyst to instantly slice, aggregate, and transpose massive datasets dynamically without writing complex conditional formulas like SUMIFS.
Employers specifically look for candidates who can manipulate pivot caches, group temporal data (e.g., rolling up daily sales into quarterly blocks), and build interactive slicers to drive C-suite meetings.
4. Automated ETL Pipelines (Power Query)

Manual data entry and repetitive copy-pasting are liabilities in a modern corporate environment. When you need to combine 50 different daily CSV exports from a regional sales team, doing it manually is not just slow; it introduces massive human error. Employers now expect analysts to build automated Extract, Transform, and Load (ETL) pipelines directly within the spreadsheet.
This is where Power Query becomes the most powerful asset in your toolkit. Operating as a background data engine, it allows you to connect Excel directly to external databases, cloud folders, or web APIs.
You can utilize its 300+ built-in transformation functions or write custom scripts using the M formula language to clean and reshape the incoming data. The true enterprise value? The pipeline is repeatable. When next month's data arrives, you simply click Refresh, and the entire cleaning and formatting process executes automatically.
5. Interactive Executive Dashboards

Raw tables, no matter how mathematically perfect, fail to communicate urgency to the C-suite. When executives open a report, they need to see the most critical operational metrics like total revenue or active customer variance instantly.
Mastering Data Visualization is not about making charts look visually appealing; it is an exercise in user experience and cognitive load. A skilled analyst knows exactly which visual architecture solves a specific business problem.
For example, they know to use stacked column charts to correlate volume across categories, or decomposition trees to conduct root-cause analysis on unusually high expenses. Employers test for your ability to build interactive dashboards where non-technical stakeholders can click a specific region on a map and watch the entire dashboard dynamically filter the underlying financial data.
6. Ecosystem Integration (Business Intelligence)

While Excel is the ultimate testing ground, it is not an isolated island. In 2026, enterprise data ecosystems rely heavily on centralized cloud architectures like Microsoft Fabric or Azure Data Lake. A modern analyst must understand how their spreadsheet logic integrates into heavier corporate systems.
This requires a fundamental mastery of broader business intelligence workflows. The architectural beauty of the Microsoft ecosystem is that the engine powering Excel's advanced data models (Power Pivot) utilizes the same formula language (DAX) as enterprise BI tools like Power BI.
Hiring managers specifically look for analysts who can prototype a complex relational model and calculate Year-over-Year (YoY) growth in Excel, knowing that the same DAX logic can be transferred seamlessly into a massive, live-streaming Power BI dashboard deployed to 10,000 corporate users.
7. Financial & Cohort Modeling

Historical reporting tells the C-suite what happened yesterday, but executive strategy requires knowing what will happen next quarter. Using Excel for Data Analysis at an enterprise level means architecting complex, forward-looking models such as Discounted Cash Flow (DCF) valuations, pricing elasticity models, or user cohort projections. Employers actively seek professionals who can utilize advanced features like Data Tables, Scenario Manager, and Goal Seek to execute robust What-If analyses.
This allows leadership to instantly visualize how a seemingly minor 2% increase in customer churn will compound and impact end-of-year revenue, removing guesswork from corporate planning.
8. Direct Database Querying (SQL)

While the spreadsheet is the ultimate analytical sandbox, it possesses a hard physical limit of 1,048,576 rows. In modern corporate environments, transactional datasets routinely exceed tens of millions of records. A premier analyst understands that they cannot export the entire database to their local machine.
Instead, employers look for candidates who can seamlessly transition into SQL. By mastering SELECT statements, complex JOIN logic, and Window Functions, an analyst can query cloud data warehouses (like Snowflake, Amazon Redshift, or BigQuery) directly. They use SQL to filter, pre-aggregate, and extract only the exact subset of data required, importing a highly optimized summary into Excel for final visualization.
9. Statistical Significance & Trend Spotting

Reporting a 3% increase in monthly web traffic is strategically useless if that variance falls within a normal margin of error. Employers require analysts who understand the mathematical foundations beneath the metrics.
This involves moving beyond simple averages to calculate standard deviation, executing linear regression to forecast sales trajectories, and smoothing out seasonal volatility using moving averages. By leveraging advanced statistical techniques and the built-in Analysis ToolPak, a competent analyst can mathematically prove the statistical significance of an A/B test. This ensures that product and marketing teams do not launch expensive campaigns based entirely on random data anomalies.
10. Programmatic Automation (Python/R)

Even the most optimized spreadsheet will eventually bottleneck when subjected to millions of rows, complex web scraping tasks, or machine learning model deployment. Modern employers expect senior analysts to recognize when a task has outgrown a graphical interface and requires programmatic intervention.
Transitioning a heavily nested, computationally expensive workbook into a lightweight Python script using the Pandas library allows an analyst to process massive datasets in seconds. Whether it is utilizing API endpoints to automatically pull live exchange rates or deploying an R script for advanced predictive clustering, adding a programmatic language to your analytical stack makes your workflows infinitely scalable.
11. Business Acumen & Domain Expertise

A mathematically perfect analysis that solves the wrong business problem is a failure. Among all the technical skills for data analyst roles, raw business acumen is the most consistently overlooked by junior candidates, yet it is the exact trait hiring managers value most. Domain expertise means understanding the why behind the data.
If a specific marketing channel shows a massive spike in customer acquisition cost (CAC), a junior analyst simply reports the spike. A senior analyst understands the market context, cross-references it with recent algorithm changes on that ad platform, and immediately advises the marketing director to reallocate the quarterly budget.
12. Strategic Data Storytelling

Your technical brilliance is entirely irrelevant if the Chief Executive Officer cannot understand your findings. Data storytelling is not about making pretty slides; it is the strategic translation of complex statistical variance into plain English, actionable business directives.
Employers test your ability to structure a narrative: identifying the core business problem, presenting the data-driven evidence without overwhelming the audience with technical jargon, and concluding with a definitive, mathematically backed recommendation. If you cannot defend your data in a high-pressure boardroom, the analysis holds no corporate value.
Why Choose Apponix? Engineering Analytical Competence
Reading a list of analytical skills will not secure you a high-paying data role; executing them in a live production environment will. The industry gap between theoretical knowledge and practical application is exactly why ambitious professionals seek out a premier Training Institute in Bangalore to architect their careers.
At Apponix Technologies, our curriculum strips away the academic fluff and immerses you directly in enterprise-grade analytics:
-
100% Practical Dataset Engineering: We do not use clean, artificial datasets. You will be trained to sanitize, merge, and analyze the exact type of messy, fragmented corporate data structures you will face on the job.
-
Industry-Veteran Mentorship: Your instructors are active Senior Data Analysts and BI Developers. You learn the specific syntax, Power Query transformations, and dashboarding strategies currently utilized by Fortune 500 tech firms.
-
End-to-End Pipeline Construction: We teach the entire data lifecycle. You will extract data via SQL, sanitize it utilizing Power Query, analyze it in Excel, and deploy it to an interactive Power BI dashboard, building a formidable, verifiable project portfolio.
Through rigorous mock technical interviews, resume optimization, and direct placement assistance, we ensure you bypass the HR filter and secure high-impact roles.
The Final Insight
Data scales infinitely; traditional reporting methods do not. As corporations increasingly rely on massive data architectures to dictate their market strategy, the basic spreadsheet operator is rapidly becoming obsolete. The modern corporate ecosystem highly compensates professionals who can sanitize raw inputs, execute complex relational logic, and architect automated reporting pipelines that drive actual executive strategy.
A lack of advanced analytical execution directly caps your strategic impact and earning potential. Step into Apponix Technologies, master enterprise-grade data analysis, and evolve from a passive software user into a definitive data strategist.
Reference:
https://www.dataquest.io/blog/data-analyst-skills/
https://www.goskills.com/Excel/Resources/Excel-skills-employers-looking-for

Apponix Academy
Apponix Academy