POPULAR COURSES
Master Programs



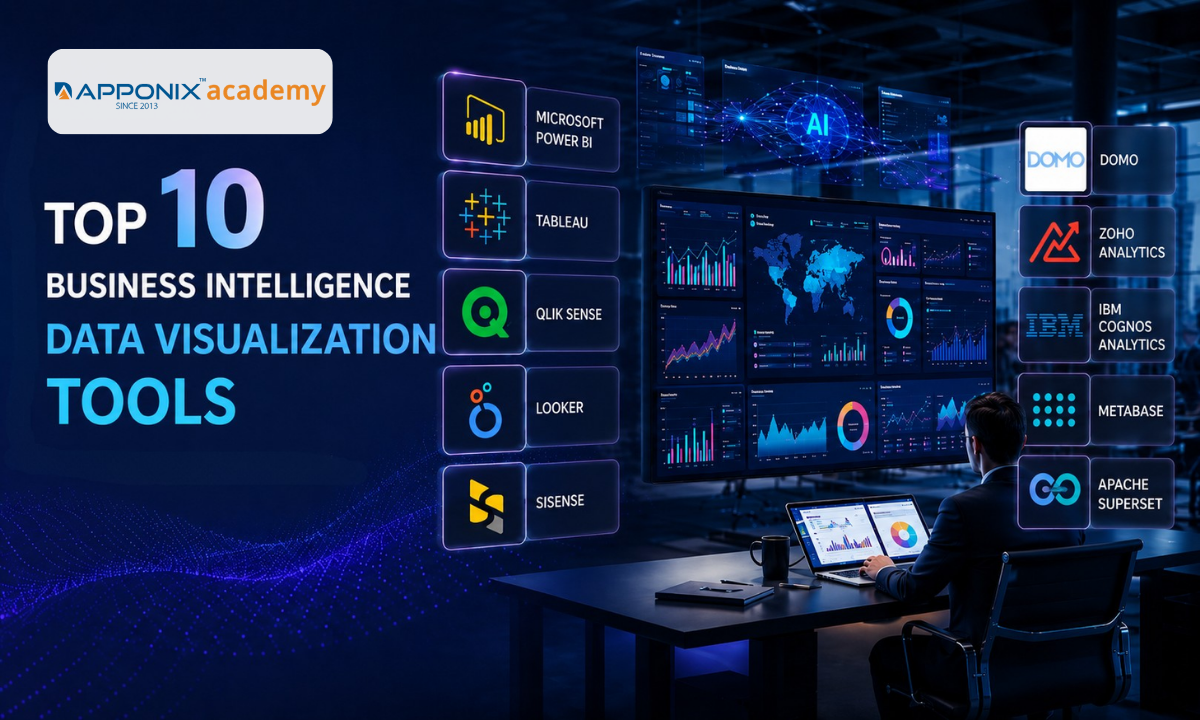
Table of contents:
|
1. The Top 10 BI Platforms for Enterprise Analytics
|
|
2. Why Choose Apponix Academy? |
|
3. Conclusion |
Raw data is a liability until it becomes an insight. In today’s enterprise landscape, companies do not suffer from a lack of information; they suffer from data blindness.
They are swimming in massive, siloed relational databases but starving for clear direction. This operational bottleneck has created an unprecedented demand for enterprise-grade business intelligence data visualization tools.
Corporate leadership teams no longer have the patience to parse through legacy spreadsheets; they require dynamic, real-time dashboards to steer their operational strategies. For anyone looking to break into this lucrative domain, enrolling in a premier Business analytics course in Bangalore is the definitive first step toward mastering these high-demand visualization ecosystems.
In the modern corporate boardroom, the ability to build a highly responsive, intuitive data interface is the ultimate differentiator. Employers are actively filtering out candidates who only understand the back-end extraction mechanics; they want analysts who can bridge the gap between complex engineering and executive strategy.
Let’s move past the theoretical noise and dive straight into the top ten platform architectures dominating the corporate ecosystem, detailing exactly why modern enterprises rely on them to maintain their competitive edge.
The Top 10 BI Platforms for Enterprise Analytics
1. Microsoft Power BI
Source: https://powerbi.microsoft.com/
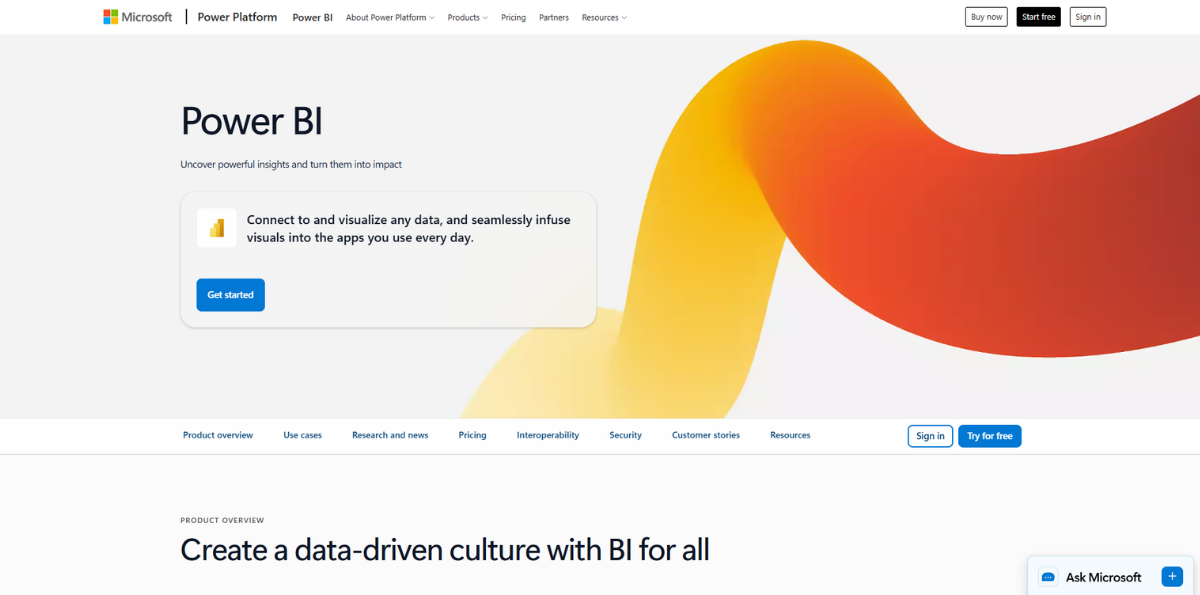
Microsoft Power BI is a powerhouse in the corporate landscape, functioning as a cloud-based business intelligence platform that integrates seamlessly with the ubiquitous Windows and Azure ecosystems. It allows users to connect to hundreds of diverse data sources, clean raw information on the fly, and publish highly secure dashboards across an entire organization. For companies heavily invested in Microsoft enterprise architecture, it is widely considered one of the best BI tools to maximize their existing software licensing investments.
The true strength of Power BI lies in its deep familiarity. Because its user interface mirrors the design language of Excel, it dramatically reduces the learning curve for junior analysts.
Under the hood, it features a native DAX (Data Analysis Expressions) engine for powerful custom calculations and robust row-level security configurations to control data access based on corporate hierarchy. It is a highly practical, low-cost platform that makes enterprise-wide data distribution incredibly efficient.
2. Tableau
Source: https://www.tableau.com/
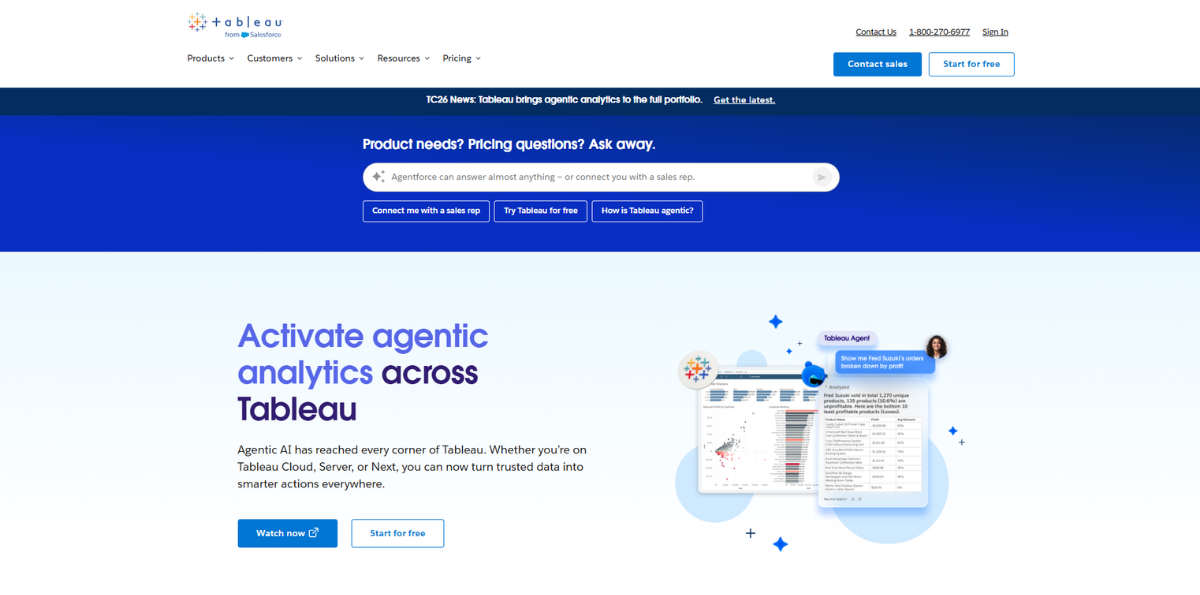
Owned by Salesforce, Tableau remains the gold standard for pure visual analytics and complex data storytelling. Built on proprietary VizQL technology, this platform translates drag-and-drop actions into optimized backend database queries, allowing analysts to explore massive datasets without constantly writing manual code. It is the dominant choice among elite data teams globally who prioritize visual panache and analytical depth.
Where Tableau truly outclasses its competitors is in its graphical sophistication and its ability to process millions of rows of data without sacrificing rendering speeds. It gives analysts the creative freedom to build highly customized chart architectures far beyond generic templates.
Combined with a massive global community and flexible live or in-memory data connection capabilities, it is built for organizations that treat data exploration as a core business strategy.
3. Qlik Sense
Source: https://www.qlik.com/
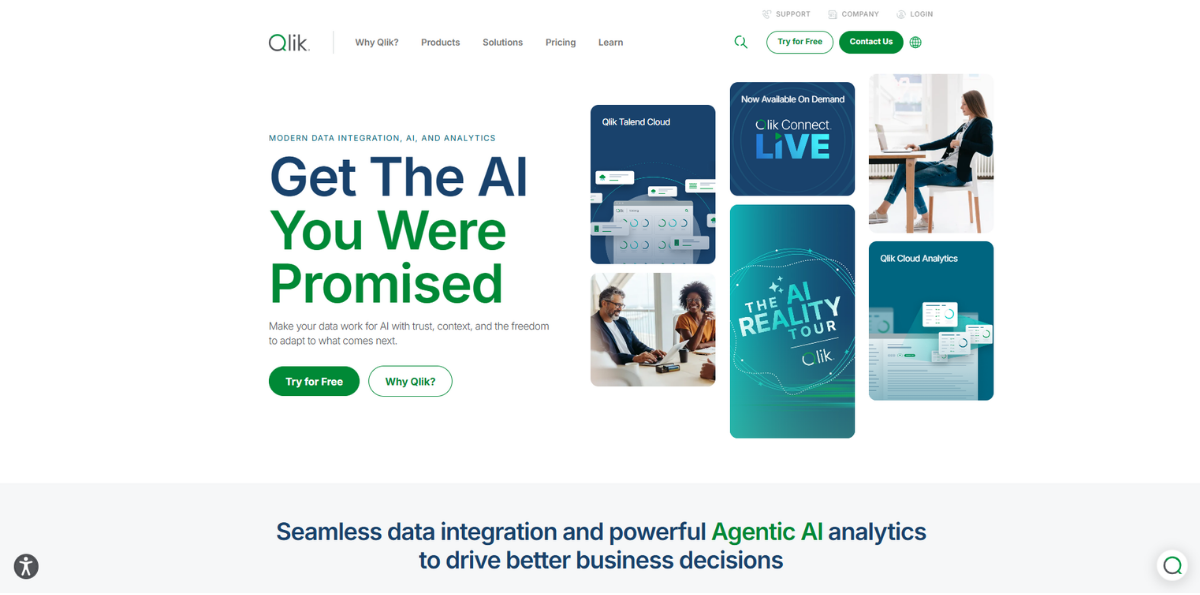
Qlik Sense stands out in a crowded market due to its unique, proprietary Associative Data Engine. Unlike traditional query-based business intelligence platforms that limit users to pre-defined relational paths, Qlik index-links every single data point. This architectural choice allows business leaders to ask unexpected questions and uncover hidden operational connections that standard hierarchical tools completely miss.
Working with Qlik Sense feels like a natural conversation with your data. It features a responsive, context-aware smart search bar that mimics natural human exploration, automatically highlighting both related and unrelated data points across disparate tables to expose business blind spots.
Backed by automated, AI-driven insight generation and a multi-cloud architecture optimized for mobile devices, it ensures that field teams have access to critical metrics exactly when they need them.
4. Looker
Source: https://cloud.google.com/looker
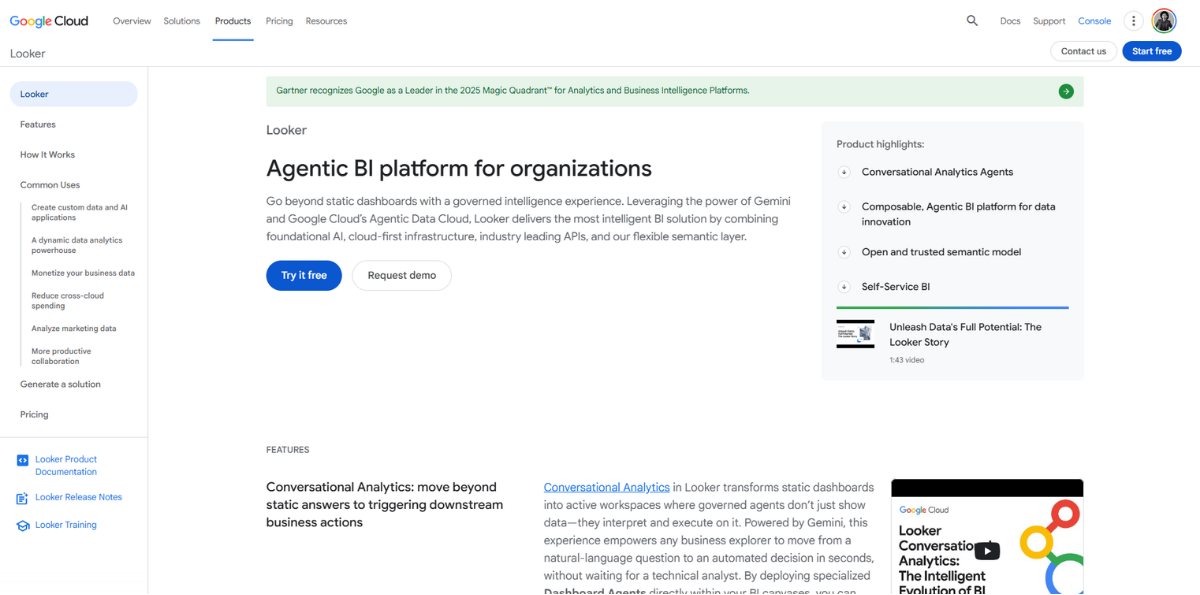
As a core component of the Google Cloud Platform (GCP) ecosystem, Looker redefines modern business intelligence by enforcing a unified semantic layer. Instead of allowing individual analysts to define their own metrics in isolation, Looker utilizes LookML (Looker Modeling Language) to centrally define business logic.
This ensures that every department, from marketing to finance, relies on the same definitions for true, uncontested data-driven decision making.
As Looker features a 100% web-based architecture, it processes data directly within your data warehouse (like BigQuery or Snowflake) without needing heavy, time-consuming data extracts.
It also shines in embedded analytics, allowing developers to seamlessly inject custom dashboards straight into internal corporate portals or client-facing apps. With Git-integrated version control built into its core, it brings software engineering discipline directly to the analytics workflow.
5. Sisense
Source: https://www.sisense.com/
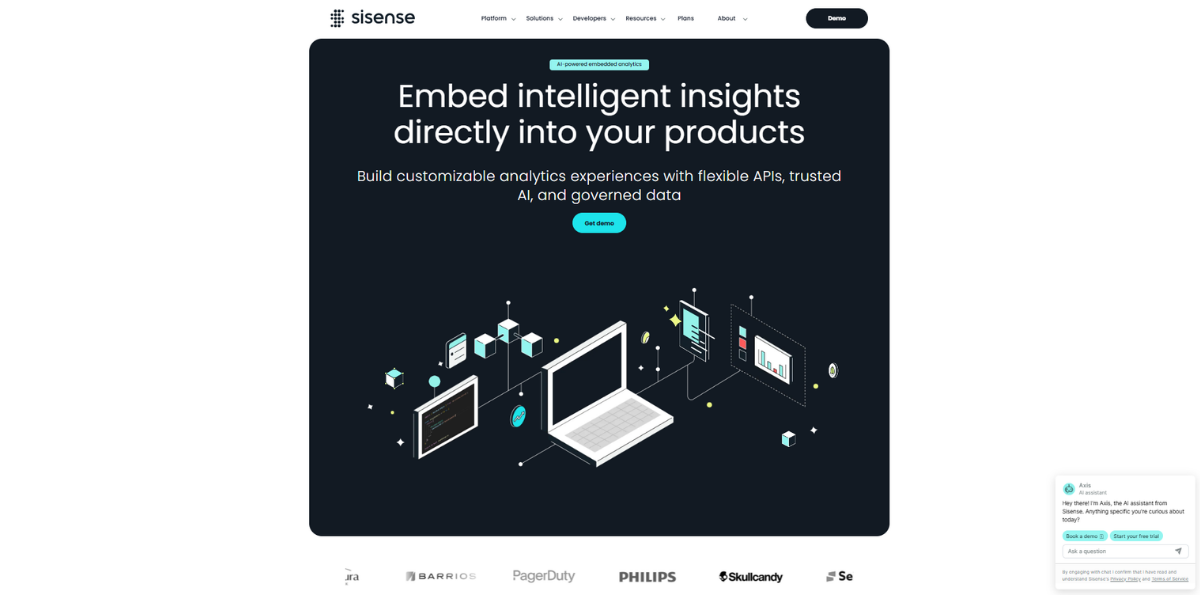
Sisense is an end-to-end analytics platform engineered explicitly for handling complex, heavily siloed data environments. Powered by its proprietary In-Chip technology, Sisense maximizes hardware efficiency by utilizing CPU cache memory rather than relying solely on slower RAM extraction, making it incredibly agile when processing messy or unstructured data.
The system is highly regarded for its radical data mashup capabilities, allowing analysts to unify completely unrelated data sources like CRM pipelines, ERP logs, and local spreadsheets into a single high-performance data model.
Furthermore, Sisense offers exceptional white-labeling features that enable software companies to embed these powerful dashboards directly into their own applications and sell them as native features.
6. Domo
Source: https://www.domo.com/
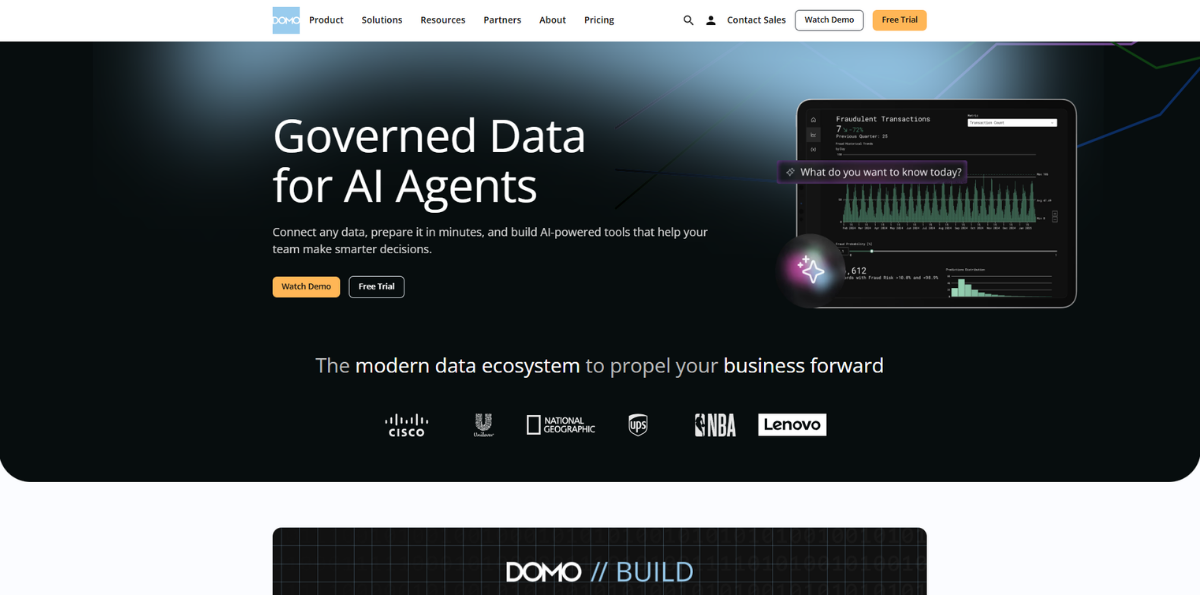
Domo operates as a fully cloud-native, low-code operating system for business intelligence that excels in real-time data integration and cross-departmental collaboration. It allows companies to connect hundreds of disparate data streams from social media metrics to internal financial databases without requiring heavy engineering infrastructure, functioning as a complete business management hub.
What makes Domo highly popular among executives is its emphasis on immediate action. It features real-time mobile alerts and social-style internal chat feeds integrated directly into specific data charts to foster rapid collaborative decisions. With over 1,000 pre-built cloud connectors and a code-free visual data-cleaning engine, it enables fast-moving operations to build and deploy custom data apps on the fly.
7. Zoho Analytics
Source: https://www.zoho.com/analytics/
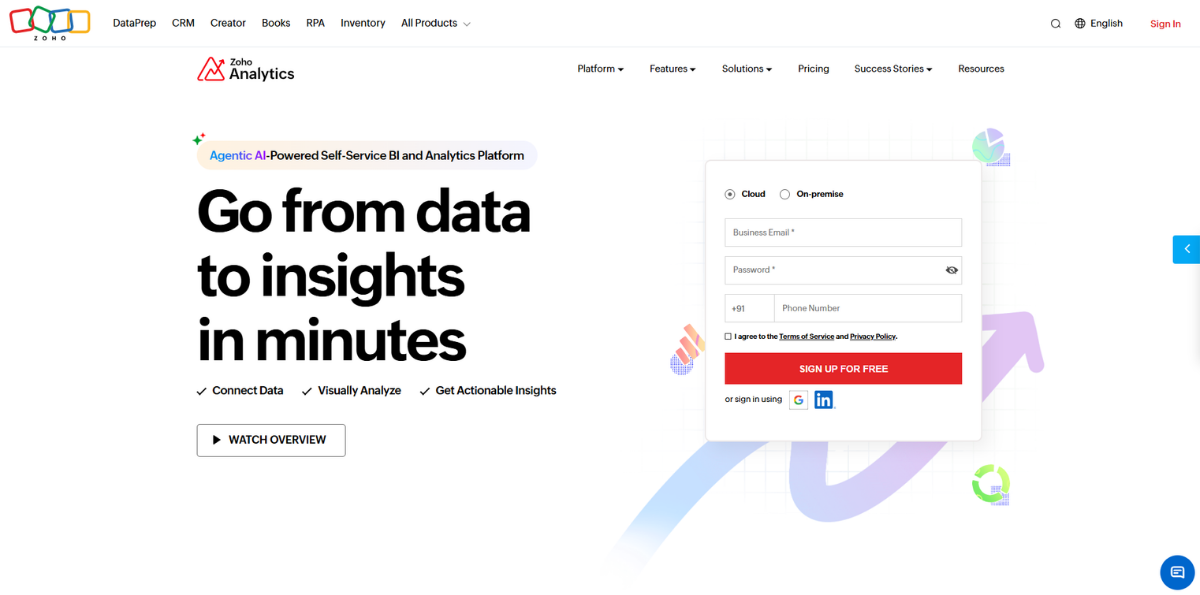
Zoho Analytics is a powerful self-service BI platform that has emerged as a premier tool within the global mid-market business sector. It offers robust machine learning-driven insights alongside deep predictive analytics, allowing scaling organizations to spot emerging market trends and automate their operational workflows. It serves as one of the most cost-effective Data Visualization Tools on the market today.
The standout feature of Zoho Analytics is Zia, an AI-driven smart assistant that allows users to type questions in plain English and instantly receive automated charts, predictive trends, and text summaries.
It offers seamless, out-of-the-box syncing with the entire suite of Zoho business software, alongside secure, white-labeled customer portals that allow service agencies to share live reporting metrics directly with external clients.
8. IBM Cognos Analytics
Source: https://www.ibm.com/products/cognos-analytics
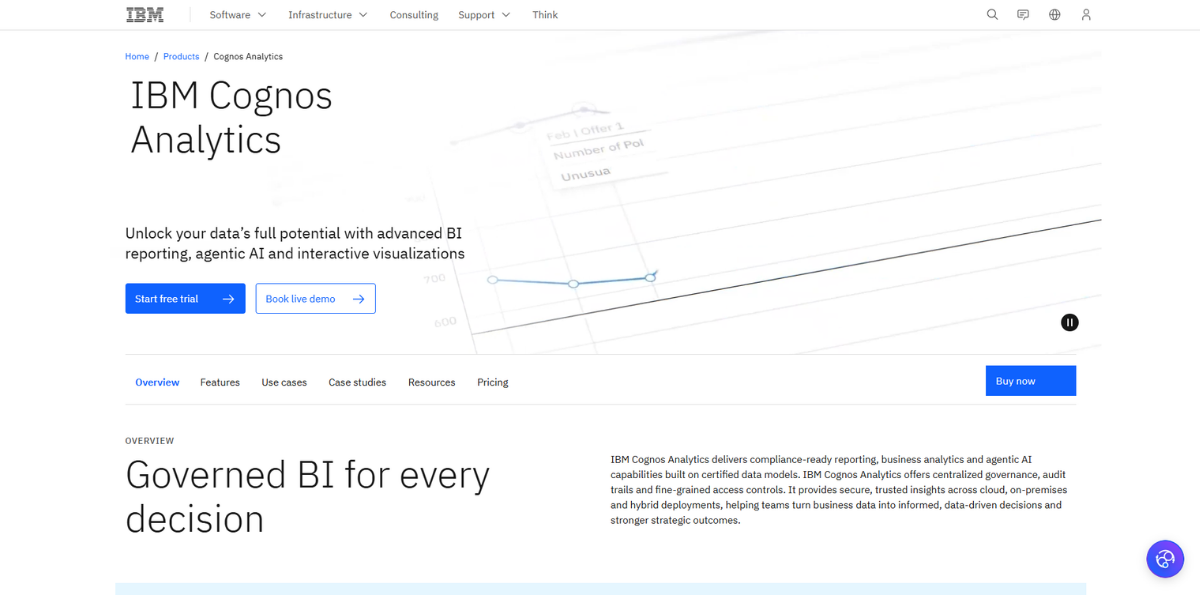
IBM Cognos Analytics is an enterprise-grade business intelligence solution engineered for massive multinational conglomerates that require strict data governance. Built around machine learning and natural language processing, Cognos guides users through the entire data lifecycle, from discovery and automated data preparation to high-level strategic reporting. It remains a reliable anchor in the world of legacy Business Intelligence Software.
Cognos is highly efficient at automated data preparation, using its built-in AI to recommend table joins, identify anomalies, and clean datasets before they are visualized.
It is famous for its advanced "report bursting" capabilities, which allow a single analyst to automatically generate and distribute thousands of personalized PDF reports to distinct regional managers simultaneously, all while satisfying rigid corporate compliance standards.
9. Metabase
Source: https://www.metabase.com/
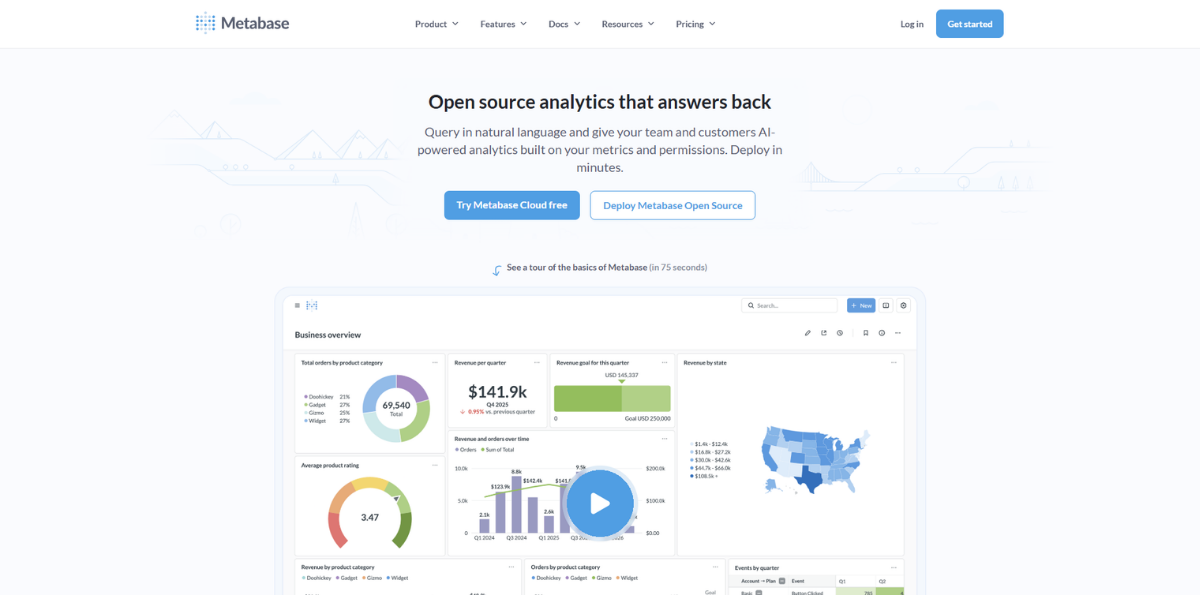
Metabase represents the modern, open-source approach to democratizing data within fast-moving tech startups and scale-ups. It is designed to be set up in less than five minutes, providing an exceptionally clean, intuitive interface that lets non-technical staff ask questions without writing SQL, while still offering a powerful native code editor for advanced data engineers.
The platform is anchored by its visual query builder, which allows product managers, marketers, and founders to slice and dice relational data without technical friction.
It integrates effortlessly into modern cloud infrastructures using Docker or AWS and features automatic, one-click "X-Rays" that auto-analyze any new data table to generate an instant dashboard of standard performance metrics.
10. Apache Superset
Source: https://superset.apache.org/
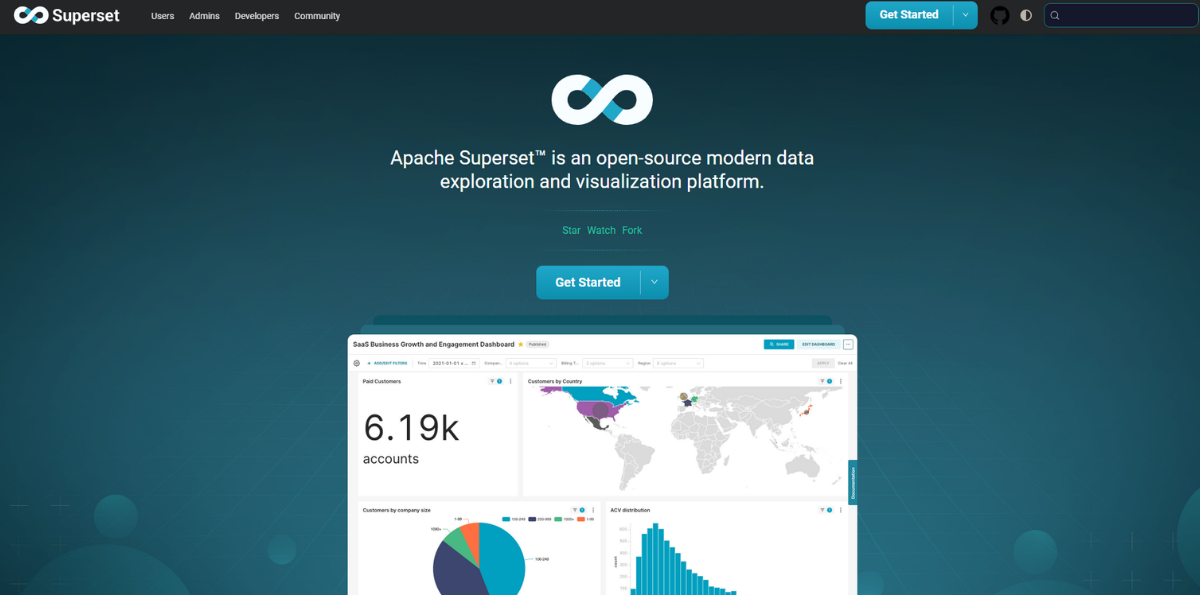
Originally born inside Airbnb, Apache Superset is a leading enterprise-grade, open-source data exploration and visualization platform built to operate at cloud scale. It is highly optimized for fast-paced engineering organizations that need to plug directly into massive cloud data warehouses and handle heavy streaming telemetry without encountering restrictive vendor-lock fees. It is currently one of the most flexible business intelligence tools for data analysis used by modern tech organizations.
Superset features a highly scalable, cloud-native architecture that handles massive datasets directly on high-performance, petabyte-scale databases like Snowflake, ClickHouse, and Druid.
As it is completely open-source, organizations can scale to thousands of active internal users without incurring seat-based licensing costs. It also boasts a highly advanced SQL IDE complete with interactive metadata browsing, giving developers total control over their data presentation.
Why Choose Apponix Academy?
This is exactly where your choice of education dictates your career trajectory. As a premier Training Institute in Bangalore, Apponix Academy is built on a singular philosophy: we do not just teach you software interfaces; we train you to execute like a senior corporate analyst and get you hired.
When you enroll in our advanced analytics programs, you are securing a direct pipeline into the IT sector, backed by our core operational guarantees:
-
100% Practical, Project-Based Learning: We strictly ban pure academic theory. You will learn by building real-world corporate dashboards, connecting to live databases, and solving the exact types of data bottlenecks you will face on the job.
-
10+ Guaranteed Interviews: We do not offer vague "placement assistance." We provide a strict minimum of 10 guaranteed interviews with our network of partnered IT recruiters and MNCs, ensuring you get the opportunity to prove your skills in the real market.
-
Active Industry Trainers: You will not be taught by career academics. Our instructors are working professionals with 6+ years of active corporate experience, teaching you the undocumented shortcuts and industry standards that textbooks miss.
-
Highly Affordable EMI Options: We remove the financial friction of upskilling. With zero-interest EMIs starting as low as ₹4,500 per month, you can master these high-demand tools and recover your entire tuition fee within your first month on the job.
The era of relying on Excel is over, and the demand for skilled data visualization experts has never been higher. Stop wasting time on passive learning and start building a portfolio that commands a premium salary.
Conclusion
Understanding the theoretical differences between Tableau, Power BI, and Looker is a great starting point, but let’s be entirely realistic about the 2026 job market: simply knowing about these tools will not get you a job. Corporate recruiters and technical hiring managers do not care if you can recite the features of a dashboard; they care if you can take a messy, 5-gigabyte dataset, clean it, and build a high-performing visual model under a strict deadline.
Watching free YouTube tutorials or clicking through cheap, pre-recorded video courses will only give you surface-level knowledge. When you sit down for a technical interview, you will be tested on real-world business scenarios, live data connections, and advanced calculations. If you lack hands-on, guided experience, your application will be immediately filtered out.
Contact Apponix Academy today to schedule a free career counseling session, explore our upcoming batches, and take the first definitive step toward a high-paying career in Business Intelligence.

Apponix Academy
Apponix Academy