POPULAR COURSES
Master Programs


Table of contents:
|
1. Core Foundations: Data Manipulation & High-Performance Computing
|
|
2. Visual Storytelling: Turning Raw Numbers into Executive Insights
|
|
3. Predictive Analytics & AI: Building Intelligent Systems
|
|
4. Deployment & Statistical Rigor: From Scripts to Web Applications
|
|
5. Why Choose Apponix? |
|
6. Conclusion |
The exponential explosion of big data and AI has made Python the undisputed language of modern analytics. At the heart of this dominance lies a vast ecosystem of Python libraries for data science that transform thousands of lines of complex C and C++ code into simple, one-line execution commands.
Whether you are building automated data pipelines, training deep learning models, or evaluating a Data science course in Bangalore to break into the tech industry, mastering these tools is the highest-leverage investment you can make.
Understanding which packages to use and when to use them is what separates beginners from industry-ready engineers.
However, entering the Python data ecosystem can feel overwhelming. With thousands of open-source packages available, students often make the mistake of trying to memorize every syntax rule or collecting libraries like badges. In production, senior data scientists rely heavily on a specialized stack of core libraries that handle specific stages of the data lifecycle: ingestion, cleaning, visualization, predictive modeling, and deployment.
In this guide, we will break down the essential libraries every student must master. Instead of static textbook summaries, we will explore practical use cases, code initialization patterns, performance trade-offs, and modern alternatives to give you a complete playbook for building portfolio-ready projects.
Core Foundations: Data Manipulation & High-Performance Computing
Before you can train sophisticated neural networks or build interactive dashboards, you need to clean, transform, and restructure raw data. In production environments, data rarely arrives pre-formatted; it is often messy, incomplete, and scattered across disparate formats.
The two fundamental libraries below form the absolute backbone of numerical computation and tabular manipulation in Python.
1. NumPy (Numerical Python)
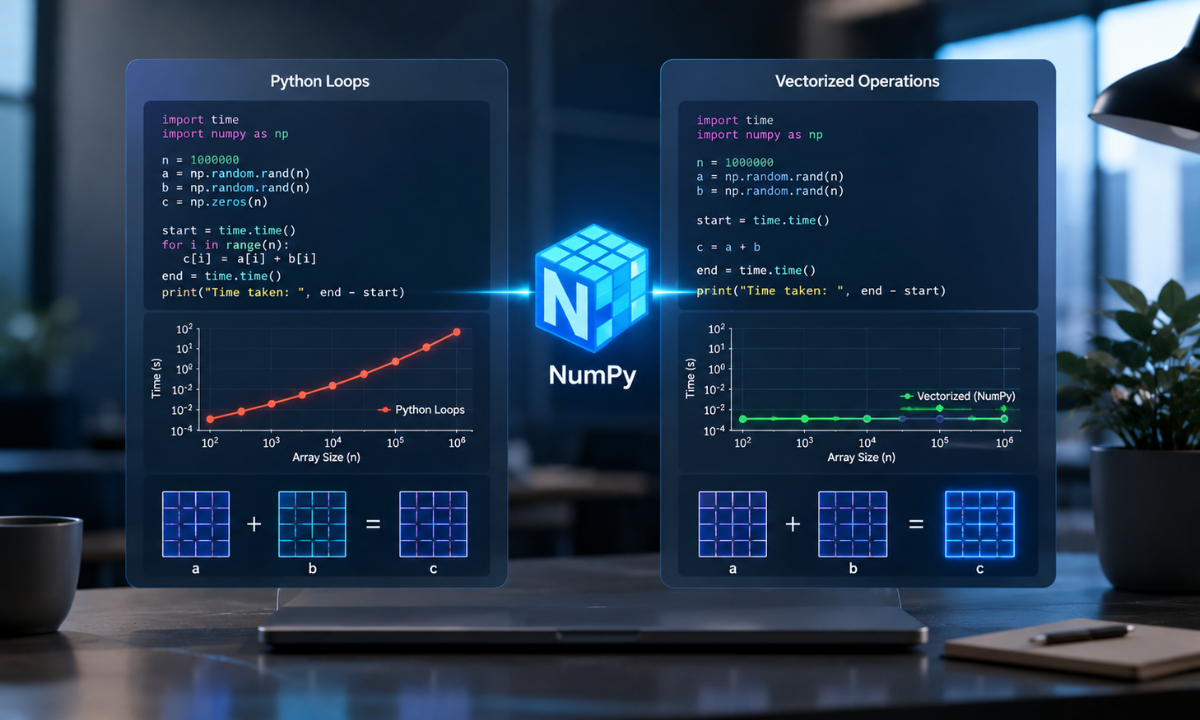
NumPy is the foundational package upon which almost the entire Python scientific stack is built. It introduces the N-dimensional array object (ndarray), which provides contiguous memory allocation and C-backed vectorized operations.
As illustrated above, rather than iterating through array elements sequentially using slow Python for loops, NumPy executes mathematical operations across whole memory blocks simultaneously (vectorization), resulting in speedups of up to 50x to 100x.
Essential Initialization & Vectorization Example:
import numpy as np
# Creating a 2D array (Matrix)
data_matrix = np.array([[10, 20, 30], [40, 50, 60]])
# Vectorized operation: Scale entire matrix without loops
scaled_matrix = data_matrix * 1.5
# Calculate column-wise mean across axis 0
col_means = np.mean(data_matrix, axis=0)
print("Scaled Matrix:\n", scaled_matrix)
print("Column Means:", col_means)
Primary Use Case: High-speed matrix algebra, signal processing, spatial transformations, and backing tensor operations in machine learning frameworks.
Student Portfolio Application: Implement a linear regression model from scratch using pure NumPy matrix math ((XᵀX)⁻¹Xᵀy) to demonstrate deep mathematical comprehension during technical interviews.
2. Pandas (Python Data Analysis Library)
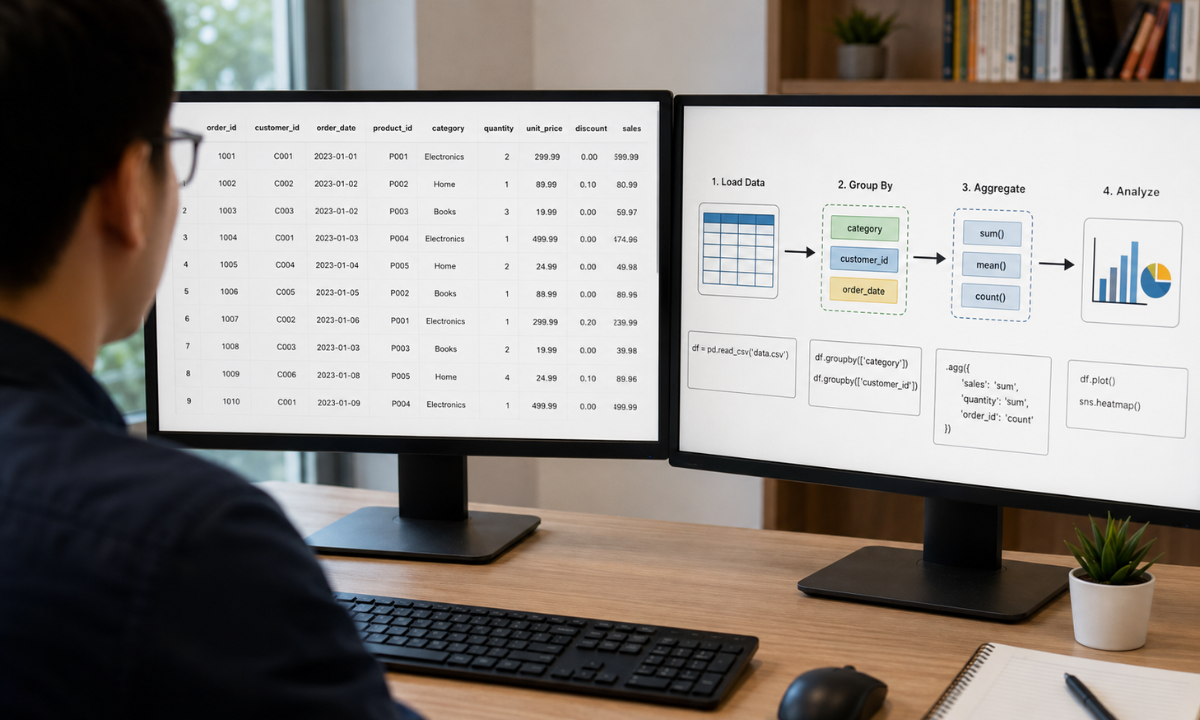
When working with structured relational data (like CSVs, Excel sheets, or SQL tables), Pandas is widely regarded as one of the most flexible Python libraries for data analysis. Built directly on top of NumPy, Pandas introduces two higher-level data structures: the 1D Series and the 2D DataFrame.
It provides built-in tools for handling missing values, joining datasets, reshaping tables, and performing SQL-like aggregations with minimal syntax.
Quick Syntax Example (Data Ingestion & Grouping):
import pandas as pd
# Load dataset and clean missing records
df = pd.read_csv("sales_data.csv")
df_clean = df.dropna(subset=["transaction_id"])
# SQL-style aggregation: Total revenue by region
regional_summary = (df_clean.groupby("region")["revenue"].agg(["sum", "mean", "count"]).reset_index())
print(regional_summary)
Modern Alternatives & Performance Upgrades
While Pandas remains the industry default, modern datasets exceeding a few gigabytes can cause RAM bottlenecks because Pandas operates in-memory on a single CPU thread.
|
Feature / Metric |
Standard Pandas |
Polars (Modern Replacement)
|
|---|---|---|
|
Engine Language |
Python / C |
Rust (Multi-threaded & Lazy Evaluation) |
|
Memory Footprint |
High (Copies datasets frequently) |
Low (Zero-copy Arrow memory format) |
|
Best For |
Standard Datasets (< 2 GB) |
Large Datasets (5 GB to 100 GB+) |
|
Syntax Style |
Imperative method chaining |
Lazy expression pipeline |
Analyst Takeaway: Master Pandas first to understand data manipulation logic, but experiment with Polars for large-scale datasets where execution speed and memory efficiency are critical.
Visual Storytelling: Turning Raw Numbers into Executive Insights
When presenting findings to stakeholders, choosing the right Python libraries for data visualization is critical to converting complex statistical output into clear, actionable business insights. Data scientists must balance raw plotting flexibility with aesthetic defaults and web interactivity.
The three libraries below represent the spectrum of data visualization in Python from low-level canvas customization to interactive web dashboards.
3. Matplotlib
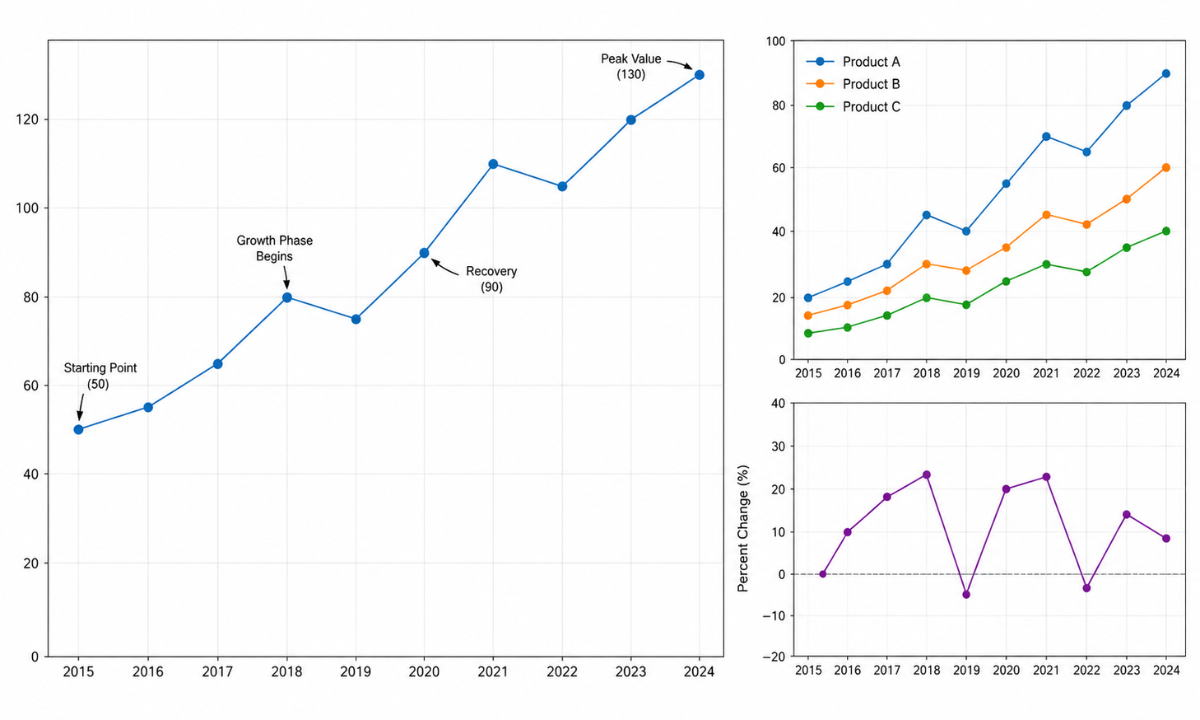
Matplotlib is the foundational, lowest-level plotting engine in the Python ecosystem. Almost all other Python charting tools are built on top of Matplotlib's Object-Oriented API. It treats every figure element axes, tick marks, grids, legends, and annotations as an individual object that can be programmatically manipulated.
Fine-Grained Object-Oriented Initialization:
import matplotlib.pyplot as plt
# Create Figure and Axes objects
fig, ax = plt.subplots(figsize=(8, 4))
# Custom plot construction
ax.plot([1, 2, 3, 4], [10, 25, 18, 30], color="#1f77b4", linewidth=2.5, marker="o")
ax.set_title("Quarterly Revenue Growth", fontsize=14, fontweight="bold")
ax.set_xlabel("Quarter")
ax.set_ylabel("Revenue ($k)")
ax.grid(True, linestyle="--", alpha=0.6)
plt.show()
When to Use: Publication-ready static figures, custom multi-panel subplots, and specialized charts requiring pixel-perfect layout adjustments.
4. Seaborn

Built directly on top of Matplotlib, Seaborn simplifies complex statistical visualizations with high-level functions, polished default themes, and native integration with Pandas DataFrames. Instead of building a distribution or regression plot line-by-line, Seaborn renders complex statistical graphics in a single function call.
High-Level Statistical Plotting:
import seaborn as sns
# Load dataset and plot distribution with regression line
df_tips = sns.load_dataset("tips")
# One-line statistical scatter plot with linear regression confidence interval
sns.lmplot(data=df_tips, x="total_bill", y="tip", hue="smoker", aspect=1.5)
Key Advantage: Built-in statistical abstractions like Kernel Density Estimation (KDE), heatmaps, pair plots, and categorical violin charts that would require dozens of lines of code in raw Matplotlib.
5. Plotly
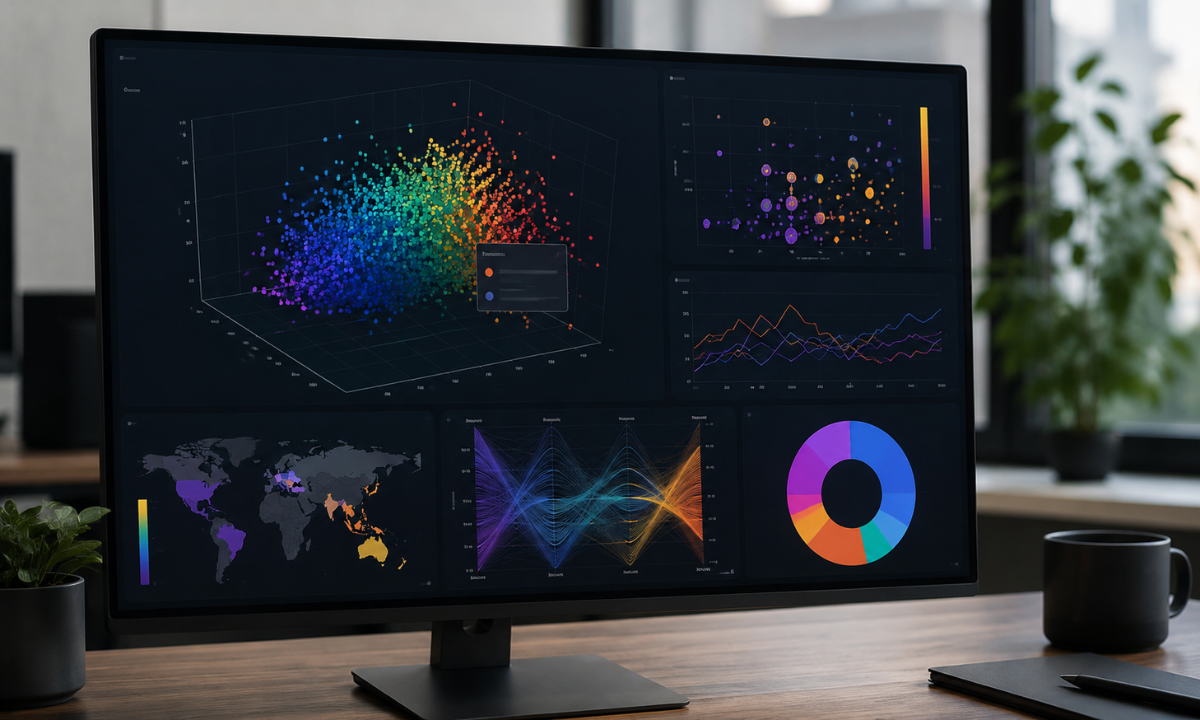
Plotly is a modern graphing library that produces interactive, web-ready HTML visualizations out of the box. Unlike static image outputs, Plotly charts allow users to hover over data points for tooltips, zoom into specific date ranges, toggle series on and off, and export high-resolution vector images directly from the browser.
Interactive Plotting Syntax (Plotly Express):
import plotly.express as px
df_iris = px.data.iris()
# Interactive 3D scatter plot
fig = px.scatter_3d(df_iris, x="sepal_length", y="sepal_width", z="petal_width", color="species", title="3D Iris Feature Distribution")
fig.show()
Visualization Selection Matrix
|
Feature / Goal |
Matplotlib |
Seaborn |
Plotly
|
|---|---|---|---|
|
Output Type |
Static Image / PDF |
Static Image / PDF |
Interactive HTML / Web |
|
Customization Level |
Maximum (Pixel-Level) |
Moderate (Preset Themes) |
High (Layout & Hover Config) |
|
Statistical Support |
Manual Calculation |
Built-in High-Level Functions |
Moderate |
|
Best Workflow Fit |
Research & Academic Papers |
Exploratory Data Analysis (EDA) |
Dashboards & Web Reports |
For a quick audio-visual breakdown on choosing between these three tools based on project requirements, check out this Matplotlib vs Seaborn vs Plotly comparison. This short comparison highlights the practical trade-offs between static customization, built-in statistical themes, and interactive web capabilities.
Predictive Analytics & AI: Building Intelligent Systems
Transitioning from descriptive statistics to predictive modeling is where the real power of data science unfolds. Whether you are predicting customer churn, classifying medical imagery, or forecasting financial markets, choosing the right Python libraries for machine learning determines how fast you can iterate from initial prototype to production deployment.
The three libraries below dominate classical machine learning, competitive tabular benchmarks, and modern deep learning research.
6. Scikit-Learn: The Golden Standard for Classical Machine Learning
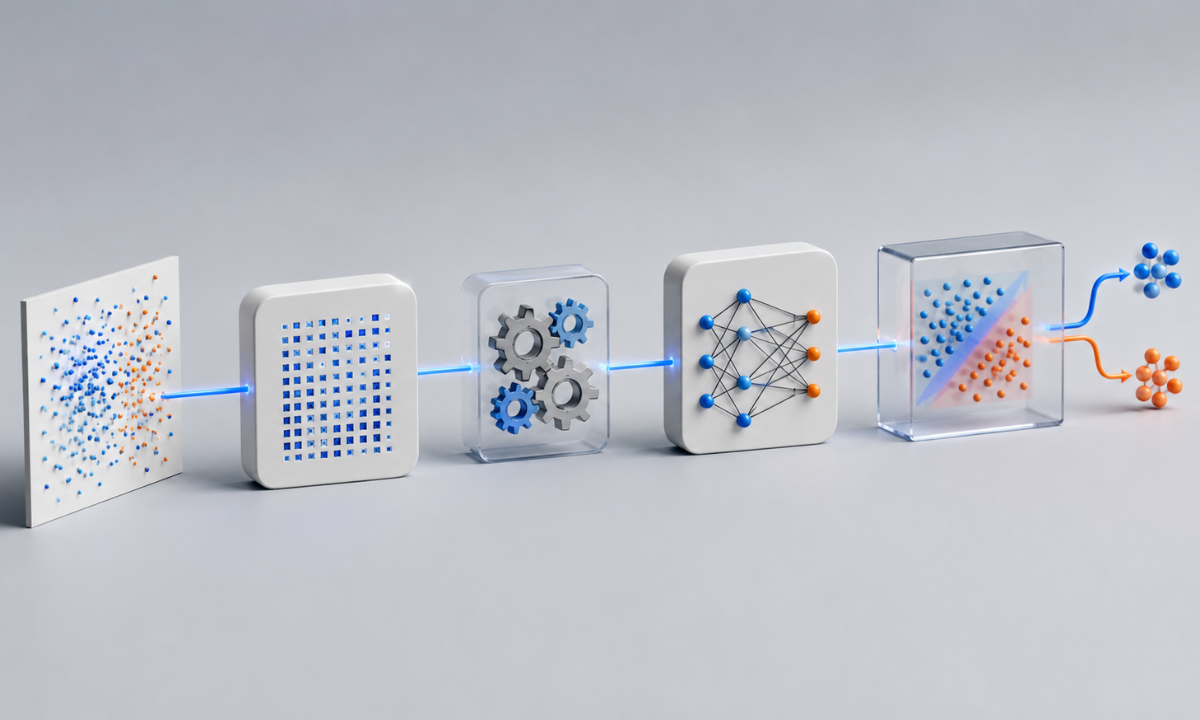
Scikit-Learn provides a clean, consistent API across virtually all standard supervised and unsupervised machine learning algorithms. From feature scaling and dimensionality reduction (PCA) to cross-validation and hyperparameter tuning, Scikit-Learn serves as the primary gateway for constructing end-to-end predictive pipelines.
from sklearn.model_selection import train_test_split
from sklearn.preprocessing import StandardScaler
from sklearn.ensemble import RandomForestClassifier
from sklearn.metrics import accuracy_score
# 1. Split features and target
X_train, X_test, y_train, y_test = train_test_split(X, y, test_size=0.2, random_state=42)
# 2. Scale features using fit_transform
scaler = StandardScaler()
X_train_scaled = scaler.fit_transform(X_train)
X_test_scaled = scaler.transform(X_test)
# 3. Train model and evaluate
model = RandomForestClassifier(n_estimators=100)
model.fit(X_train_scaled, y_train)
predictions = model.predict(X_test_scaled)
print("Model Accuracy:", accuracy_score(y_test, predictions))
Primary Strengths: Unified .fit(), .transform(), and .predict() execution interface; robust model evaluation tools (gridSearchCV, classification_report).
Student Project Idea: Build an automated customer churn predictor using a Random Forest or Logistic Regression pipeline with cross-validation.
7. XGBoost (Extreme Gradient Boosting)

While deep learning handles raw unstructured inputs like images and audio, XGBoost remains the undisputed king for structured, tabular datasets. By combining weak decision trees sequentially using parallel gradient boosting, XGBoost delivers exceptional predictive accuracy with built-in regularization to prevent overfitting.
Why XGBoost Dominates Tabular Benchmarks:
-
Built-in Missing Value Handling: Automatically learns optimal split directions for sparse matrices or missing records.
-
Parallel & GPU Processing: Leverages multi-core CPUs and CUDA-enabled GPUs for blazing-fast training on millions of rows.
-
Custom Loss Functions: Allows engineers to define specialized objective functions tailored to asymmetric business costs (e.g., fraud detection false negatives).
8. PyTorch: Flexible Deep Learning & Neural Networks

Developed by Meta AI, PyTorch has become the preferred deep learning framework for top research labs and enterprise AI production. Its primary innovation is dynamic computation graphs (Eager Execution), which allow neural network architectures to be modified on the fly during runtime, making code debugging as simple as inspecting standard Python code.
import torch
import torch.nn as nn
# Define GPU device if available
device = torch.device("cuda" if torch.cuda.is_available() else "cpu")
# Simple Feedforward Neural Network Architecture
class MultiLayerPerceptron(nn.Module):
def __init__(self, input_dim, hidden_dim, output_dim):
super(MultiLayerPerceptron, self).__init__()
self.layer1 = nn.Linear(input_dim, hidden_dim)
self.relu = nn.ReLU()
self.layer2 = nn.Linear(hidden_dim, output_dim)
def forward(self, x):
out = self.layer1(x)
out = self.relu(out)
out = self.layer2(out)
return out
model = MultiLayerPerceptron(input_dim=10, hidden_dim=32, output_dim=1).to(device)
ML & AI Framework Architecture Comparison
|
Model Type / Task |
Recommended Framework |
Key Advantage
|
|---|---|---|
|
Baseline Classical Models |
Scikit-Learn |
Rapid prototyping, standard evaluation API, zero setup overhead |
|
Competitive Tabular Data |
XGBoost |
State-of-the-art accuracy on structured tables, handling missing data |
|
Deep Learning & GenAI |
PyTorch |
Dynamic execution graph, custom CUDA acceleration, flexible neural network design |
Deployment & Statistical Rigor: From Scripts to Web Applications
Training a model inside a Jupyter Notebook is only half the battle. To turn a project into a true portfolio piece, you must be able to deploy your model as an interactive application and validate your underlying data assumptions with mathematical rigor.
The final two libraries bridge the gap between statistical hypothesis testing and production deployment.
9. Streamlit: Building Data Web Apps in Minutes
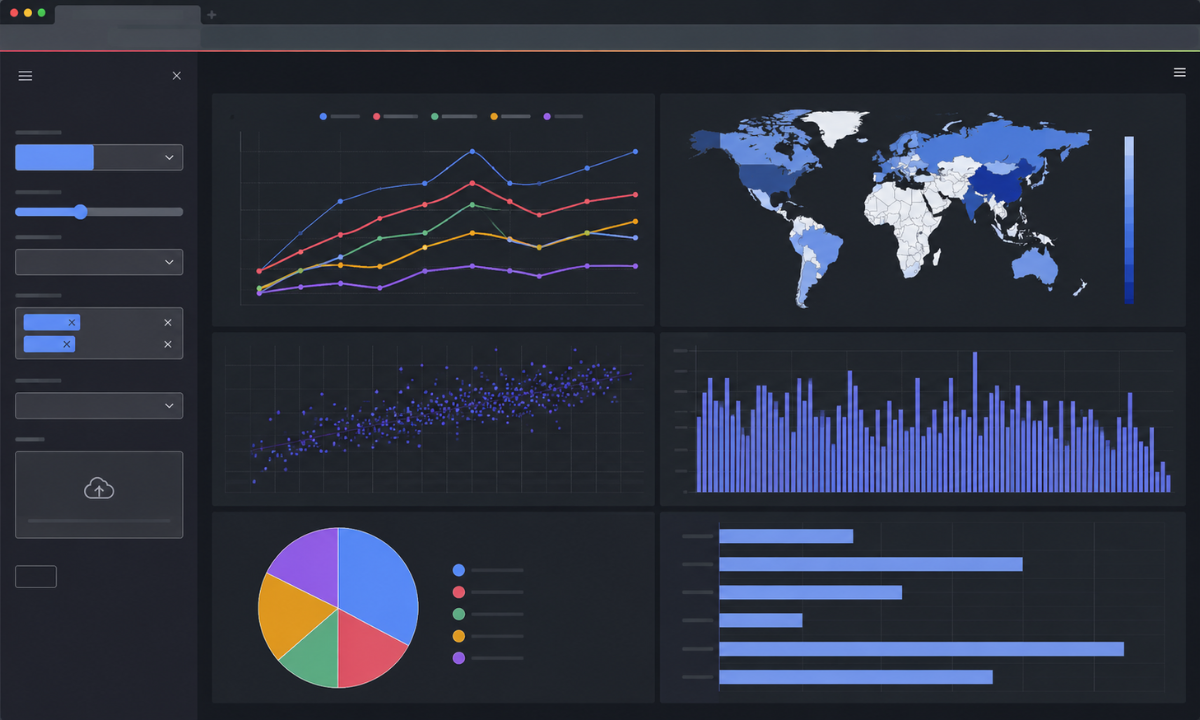
Historically, sharing a data project required writing HTML, CSS, and Flask/Django backend routes. Streamlit changes this completely by allowing you to transform Python scripts into clean, shareable web apps using pure Python code.
It integrates seamlessly with Pandas, Matplotlib, Plotly, and Scikit-Learn, letting users adjust sliders, upload custom CSVs, and view real-time model outputs in their web browser.
Turning a Script into an Interactive UI:
import streamlit as st
import pandas as pd
st.title("Customer Churn Risk Calculator")
# Interactive input widgets
tenure = st.slider("Customer Tenure (Months)", min_value=1, max_value=72, value=12)
monthly_charges = st.number_input("Monthly Charges ($)", min_value=18.0, max_value=150.0, value=65.0)
# Execute model prediction on button click
if st.button("Calculate Risk"):
# Pass inputs into pre-trained model pipeline
st.success("Predicted Churn Probability: 14.2% (Low Risk)")
Portfolio Pro Tip: Always wrap your machine learning projects in a Streamlit interface and host them for free on Streamlit Community Cloud or HuggingFace Spaces. Adding a live app link to your resume immediately separates you from candidates who only share raw .ipynb files.
10. Statsmodels: Statistical Hypothesis Testing & Econometrics
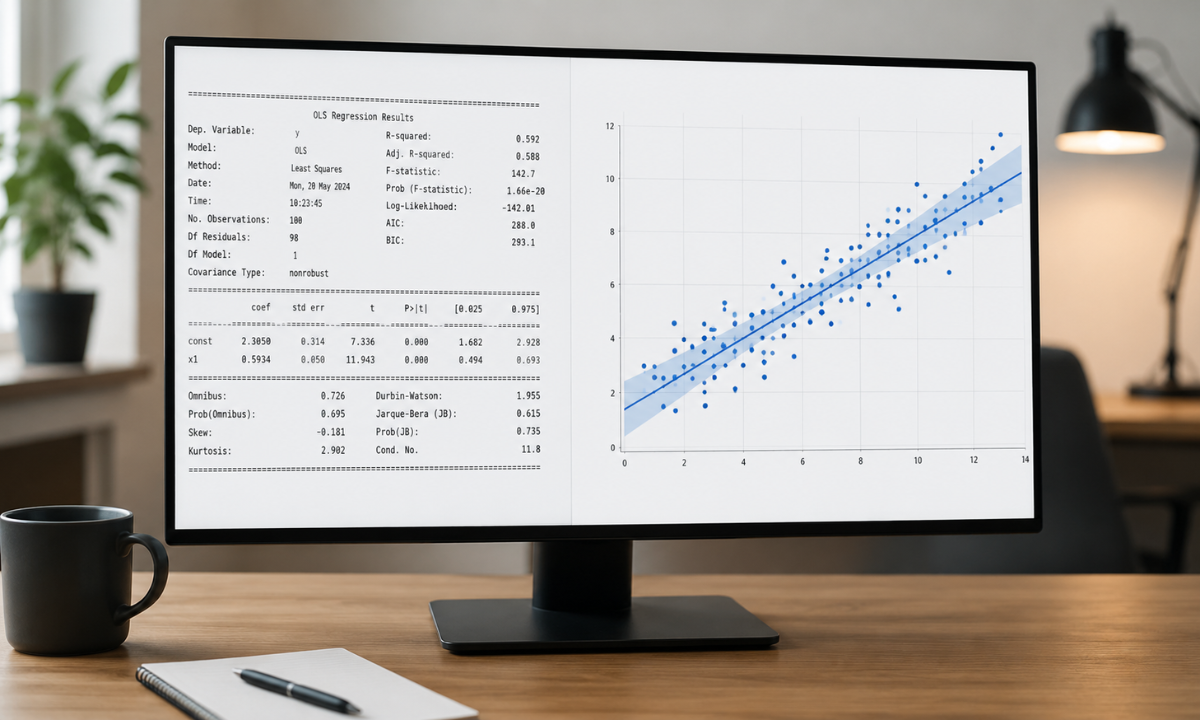
While machine learning frameworks focus primarily on predictive accuracy on unseen data, Statsmodels focuses on statistical inference, p-values, confidence intervals, and understanding underlying population relationships.
Detailed OLS Summary Output Example:
import statsmodels.api as sm
# Add constant for intercept estimation
X_with_intercept = sm.add_constant(X)
# Fit Ordinary Least Squares (OLS) model
ols_model = sm.OLS(y, X_with_intercept).fit()
# Print comprehensive statistical report
print(ols_model.summary())
Unlike Scikit-Learn, which outputs raw prediction arrays, ols_model.summary() generates an exhaustive econometric report showing R-squared values, F-statistics, p-values, and Standard Errors for every single feature, allowing you to determine exact statistical significance.
Machine Learning vs. Statistical Modeling: When to Use Which
|
Analytical Goal |
Primary Tool |
Output Focus
|
|---|---|---|
|
Predictive Accuracy ("What will sales be next quarter?") |
Scikit-Learn / XGBoost |
Minimizing prediction error (RMSE, MAE, F1-Score) on test splits |
|
Statistical Inference ("Does advertising expenditure significantly impact sales?") |
Statsmodels |
Hypothesis testing, p-values (p < 0.05), t-tests, and confidence intervals |
|
Interactive Portfolio Sharing |
Streamlit |
Web application GUI for non-technical end-users |
Why Choose Apponix?
Mastering Python libraries is the first step toward a successful data science career, but translating code snippets into enterprise-grade data pipelines requires structured guidance and practical exposure. As a premier Training institute in Bangalore, Apponix Technologies bridges the gap between academic theory and real-world deployment.
Our industry-aligned data science programs are designed to transform students into job-ready data professionals through hands-on application:
-
100% Project-Based Curriculum: Build production-grade projects using Pandas, Scikit-Learn, PyTorch, and Streamlit rather than just memorizing syntax.
-
Mentorship from Senior Engineers: Learn directly from industry veterans who bring active corporate data architecture challenges into the classroom.
-
Portfolio & Code Review Support: Receive personalized feedback on your GitHub repositories, code efficiency, and project architecture to stand out in technical hiring rounds.
Tap into direct interview pipelines with top product companies and Global Capability Centers (GCCs), backed by mock interview sessions and resume preparation.
Conclusion
The Python data science ecosystem is vast, but you don't need to learn every package at once. Focus on mastering the foundational tools layer by layer: start with NumPy and Pandas for data wrangling, move to Seaborn and Plotly for visualization, leverage Scikit-Learn and XGBoost for machine learning, and deploy your final model using Streamlit.
By focusing on building end-to-end, functional applications rather than collecting isolated code snippets, you develop the practical problem-solving mindset that top hiring managers look for.
Ready to start your data science journey? Connect with the academic advisors at Apponix Technologies today, explore our practical training tracks, and build the technical muscle memory needed to land a high-impact data science role.
Reference:
1. https://www.jobaajlearnings.com/blog/top-python-libraries-every-data-scientist-should-know
2. https://www.simplilearn.com/top-python-libraries-for-data-science-article
Apponix Academy
Apponix Academy