POPULAR COURSES
Master Programs



Table of contents:
|
1. Data Exploration, Manipulation & Interactive Development
|
|
2. Machine Learning Frameworks & Deep Learning Libraries
|
|
3. Business Intelligence & Interactive Data Visualization
|
|
4. Essential Analytical & Statistical Techniques for Modern Practitioners
|
|
5. Why Choose Apponix Technologies for Your Data Science Journey? |
|
6. Conclusion |
Mastering data science tools and techniques is essential for converting raw enterprise data into actionable predictive insights. Partnering with a premier Trainng Institute in Bangalorie equips aspiring analysts and engineers with the technical acumen required to navigate modern machine learning workflows, statistical modeling, and data pipelines.
Enrolling in a specialized Data science course in Bangalore enables professionals to build production-grade competencies across exploratory data analysis, algorithmic modeling, and business intelligence, bridging the gap between theoretical mathematics and industry deployment.
The modern analytics landscape has shifted from isolated spreadsheet manipulations toward distributed, automated, and AI-augmented ecosystems. Today's data scientists must navigate an integrated lifecycle that demands versatility across programming paradigms, mathematical foundations, and visualization frameworks:
-
Exploratory Analysis & Data Wrangling: Cleansing unstructured datasets, imputing missing dimensions, and identifying underlying distributions before feeding data into algorithmic pipelines.
-
Predictive Modeling & Deep Learning: Selecting appropriate mathematical algorithms, tuning hyperparameters, and regularizing models to ensure high generalization on production data.
-
Business Translation & Visual Storytelling: Converting intricate statistical outputs and loss functions into interactive executive dashboards that guide corporate investments.
Mastering this end-to-end toolchain transforms aspiring practitioners from syntax executors into strategic problem solvers capable of delivering measurable business value.
This comprehensive guide breaks down the essential software suites, algorithmic methodologies, and practical frameworks required to build a high-impact career in modern data science.
Data Exploration, Manipulation & Interactive Development
Before applying predictive models or neural networks, practitioners spend the majority of their project lifecycle within data wrangling and exploratory data analysis (EDA).
Leveraging foundational data science tools during this initial phase allows analysts to clean messy real-world datasets, detect anomalies, uncover hidden correlations, and structure tabular data for algorithmic processing.
Core Exploration & Computing Frameworks
-
Interactive Prototyping with Jupyter Notebooks: The Jupyter ecosystem remains the standard interactive computing environment for data science teams. It combines executable code cells with rich Markdown text, LaTeX equations, and inline visual plots, enabling reproducible experimentation, rapid iterative testing, and seamless collaboration across engineering teams.
-
High-Performance Numerical Processing with NumPy: NumPy provides support for large, multi-dimensional arrays and matrices along with an extensive collection of high-level mathematical functions. Its C-based vectorized operations eliminate the computational overhead of standard Python loops when processing large numerical datasets.
-
Tabular Data Wrangling with Pandas: Pandas delivers high-performance data structures like DataFrames and Series. It streamlines essential data cleaning operations, such as handling missing values (NaN imputation), filtering data slices, merging complex datasets, and aggregating time-series records.
-
Structured Data Extraction with SQL: SQL serves as the foundational language for querying relational databases and enterprise data warehouses. Data professionals rely on advanced SQL operations including window functions (ROW_NUMBER(), RANK()), complex multi-table joins, and conditional aggregations to extract and preprocess datasets directly at the storage source.
Mastering these computational engines ensures that raw data extracted from transactional databases, web APIs, or flat files is efficiently sanitized and structured before entering machine learning pipelines.
Foundational Exploratory Techniques
-
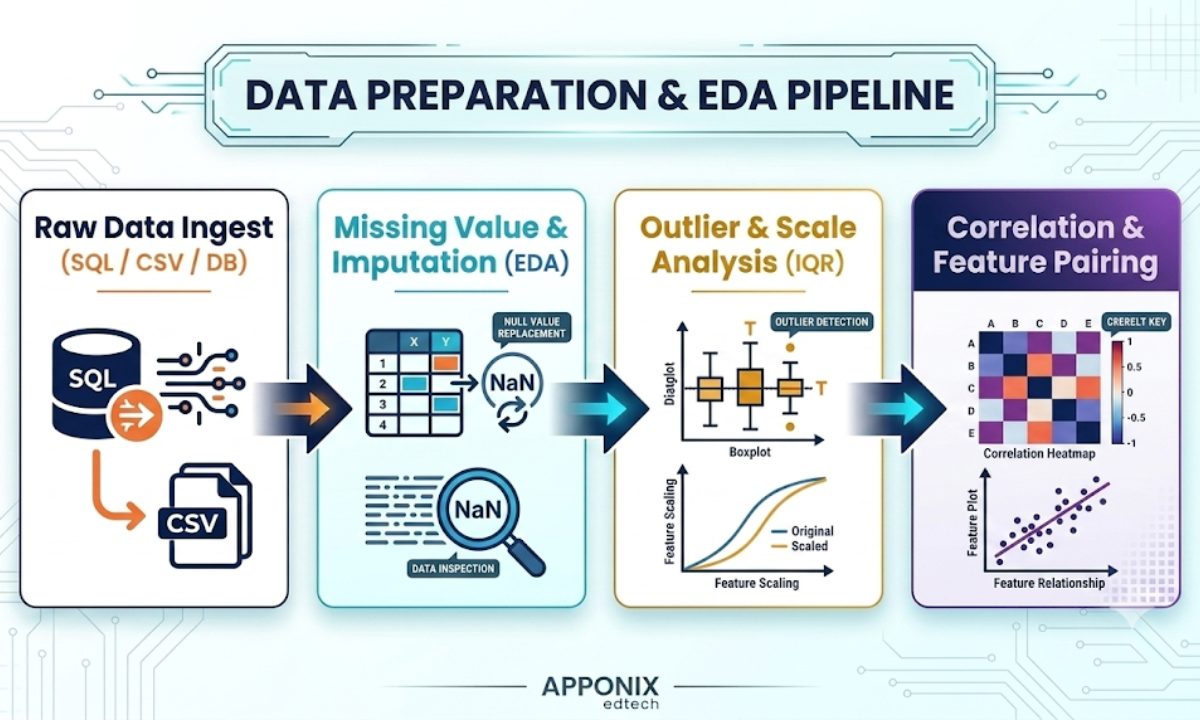
Missing Value Imputation & Data Cleansing: Replacing null data points using statistical strategies (mean, median, mode) or advanced predictive methods like K-Nearest Neighbors (KNN) imputation and iterative imputers to maintain dataset integrity without introducing bias.
-
Outlier Detection & Distribution Analysis: Utilizing Interquartile Range (IQR) calculations, Z-scores, and density plots to detect anomalous sensor readings, fraudulent transactions, or measurement errors that could skew algorithmic weight updates.
-
Correlation & Hypothesis Testing: Evaluating linear and non-linear relationships using Pearson and Spearman correlation matrices, followed by statistical significance tests (t-tests, Chi-Square, ANOVA) to validate whether observed patterns represent true population characteristics.
Executing these exploratory techniques within structured computational notebooks ensures that models are trained on reliable, mathematically sound foundations rather than noisy artifacts.
Machine Learning Frameworks & Deep Learning Libraries
Once data is cleansed and transformed, the modeling phase begins. Aspiring professionals must distinguish between classical statistical algorithms which excel on structured tabular data and deep learning architectures designed for complex, high-dimensional unstructured inputs such as images, natural language, and audio.
Selecting the right algorithmic framework ensures both high predictive accuracy and computational efficiency during training and deployment.
Machine Learning & Deep Learning Ecosystem Matrix
|
Framework / Library |
Core Algorithmic Focus |
Primary Strengths |
Enterprise Production Use Cases
|
|---|---|---|---|
|
Scikit-learn |
Classical Supervised & Unsupervised Learning |
Standardized API, comprehensive preprocessing pipelines, built-in cross-validation |
Credit risk scoring, customer churn prediction, fraud classification |
|
XGBoost / LightGBM |
Extreme Gradient Boosted Decision Trees |
Superior performance on structured tabular records, fast distributed training |
High-frequency financial modeling, algorithmic ranking, tabular Kaggle benchmarks |
|
TensorFlow |
Deep Neural Networks & Distributed Deep Learning |
Enterprise-grade production deployment (TF Serving), native TPU acceleration, robust Keras abstraction |
Autonomous computer vision, real-time speech recognition, large-scale recommendation systems |
|
PyTorch |
Dynamic Computational Graphs & Research Deep Learning |
Intuitive debugging, dynamic tensor evaluation, dominant framework across modern AI research |
Generative AI, Large Language Model (LLM) fine-tuning, natural language processing (NLP) |
Core Modeling Frameworks & Production Implementations
-
Classical Modeling with Scikit-learn: Built on top of NumPy, SciPy, and Matplotlib, Scikit-learn serves as the industry standard for traditional machine learning workflows. Its consistent fit(), transform(), and predict() syntax simplifies the implementation of linear regression, support vector machines (SVM), random forests, and k-means clustering.
Furthermore, Scikit-learn’s Pipeline feature encapsulates data transformations and model fitting into a single reproducible artifact, preventing data leakage between training and testing sets.
-
Ensemble Methods & Gradient Boosting: Algorithms like XGBoost, LightGBM, and CatBoost iteratively train sequential decision trees, where each subsequent tree minimizes the residual errors of the previous ones.
These tree-based models consistently outperform standard neural networks on structured tabular datasets, offering superior handling of missing values, non-linear feature boundaries, and imbalanced target distributions.
-
Deep Learning at Scale with TensorFlow: Developed by Google, TensorFlow delivers a production-grade ecosystem for designing, training, and deploying deep neural networks across distributed GPU/TPU clusters.
Its high-level Keras interface allows practitioners to construct convolutional neural networks (CNNs) and recurrent architectures with minimal boilerplate, while TensorFlow Lite and TensorFlow Serving enable low-latency inference across cloud microservices and mobile edge devices.
Integrating these specialized libraries into your development stack ensures that you apply the most computationally efficient algorithm to each specific business problem rather than defaulting to complex neural networks when simpler, interpretable models suffice.
Algorithmic Evaluation & Model Validation
Training a model is only half the battle; ensuring it generalizes effectively to unseen enterprise data requires rigorous validation techniques and domain-appropriate evaluation metrics.
-
K-Fold Cross-Validation: Partitioning training data into k distinct subsets to evaluate model stability across multiple validation iterations, preventing over-reliance on an unrepresentative single train-test split.
-
Precision, Recall & F1-Score: Evaluating performance on imbalanced datasets (such as rare financial fraud or disease detection) where standard classification accuracy yields deceptive results.
-
ROC-AUC Analysis: Measuring the Area Under the Receiver Operating Characteristic curve to assess a classifier's ability to distinguish between positive and negative classes across varying probability thresholds.
Applying these rigorous validation protocols guarantees that predictive models deliver reliable, repeatable value in production without suffering from catastrophic overfitting or performance degradation.
Business Intelligence & Interactive Data Visualization
Predictive models and statistical algorithms provide value only when technical findings are translated into clear, actionable business decisions.
Enterprise stakeholders, product managers, and C-suite executives rarely inspect raw code or model loss logs; they rely on intuitive visual analytics to monitor real-time key performance indicators (KPIs), track forecasting deviations, and evaluate risk distributions.
Enterprise BI Platforms: Tableau vs. Power BI
Selecting between the industry's two dominant business intelligence platforms depends on an organization's underlying data architecture, licensing ecosystem, and reporting complexity.
|
Platform / Tool |
Primary Architectural Strength |
Data Calculation Engine |
Enterprise Integration |
Ideal Enterprise Use Case
|
|---|---|---|---|---|
|
Tableau |
High-dimensional visual exploration & advanced spatial mapping |
Level of Detail (LOD) Expressions & Table Calculations |
Salesforce ecosystem, multi-cloud data warehouses (Snowflake, BigQuery) |
Deep exploratory data analytics, executive dashboard storytelling, custom geospatial visuals |
|
Power BI |
Cost-effective enterprise modeling & self-service reporting |
Data Analysis Expressions (DAX) & Power Query (M) |
Microsoft 365, Azure Synapse, Microsoft Fabric |
Corporate performance reporting, financial metric consolidation, departmental KPI monitoring |
|
Plotly & Dash |
Interactive, web-native programmatic dashboards |
Python / R runtime engine |
Custom web applications, containerized microservices |
Real-time sensor telemetry, bespoke MLOps monitoring, programmatic ML model inspection |
Core Visualization Engines & Dashboard Capabilities
-
Executive Dashboarding with Tableau: Widely recognized for its rendering capabilities and fluid user experience, Tableau allows analysts to quickly discover patterns across billions of rows. By leveraging calculated fields and Level of Detail (LOD) expressions, teams can compute granular aggregations across different dimensions without restructuring underlying database schemas.
-
Enterprise Reporting with Power BI: Deeply embedded within corporate IT environments, Power BI connects data transformation through Power Query with DAX modeling to create automated operational reports. Its seamless integration with Microsoft Teams, SharePoint, and Azure active directories makes it the premier standard for large-scale enterprise report distribution.
-
Programmatic Plotting with Seaborn & Plotly: Within development notebooks, data scientists utilize Seaborn for rapid statistical distribution mapping (such as box plots, violin plots, and correlation heatmaps). When client-side interactivity is required, Plotly enables zooming, hovering, and multi-variable filtering directly within web applications.
Mastering both programmatic and GUI-based visualization tools enables data professionals to move between rapid statistical diagnostics in development notebooks and polished executive reporting in corporate boardrooms.
Principles of High-Impact Visual Storytelling
-
Minimizing Cognitive Load & Chart Clutter: Removing unnecessary 3D elements, excessive grid lines, and decorative graphics to highlight critical data trends and outlier deviations.
-
Contextual KPI Benchmarking: Pairing raw metrics with historical moving averages, projected quarterly targets, and percentage variances to provide immediate business context.
-
Interactive Drill-Down Topologies: Structuring dashboards so users can view high-level summaries and click through to inspect regional, temporal, or transactional details without needing custom SQL extracts.
Applying structured dashboard design principles ensures that business analysts and executive leaders can extract actionable conclusions in seconds, transforming raw mathematical models into strategic organizational assets.
Essential Analytical & Statistical Techniques for Modern Practitioners
Mastering data science libraries provides the syntax to build models, but applying statistical rigor determines whether those models perform accurately in production. Without a solid grasp of underlying mathematical techniques, practitioners risk deploying models that suffer from data leakage, multicollinearity, and poor out-of-sample generalization.
Core Statistical & Modeling Techniques Matrix
|
Analytical Technique |
Mathematical Objective |
Primary Problem Solved |
Core Production Application
|
|---|---|---|---|
|
Principal Component Analysis (PCA) |
Orthogonal transformation maximizing variance along eigenvectors |
Curse of dimensionality, redundant feature noise |
Image compression, high-dimensional sensor data clustering |
|
L1 / L2 Regularization |
Penalizing loss function via coefficient magnitude constraints |
Model overfitting, high variance, multicollinearity |
Sparse feature selection, stable linear/logistic regression |
|
Bayesian Hyperparameter Tuning |
Probabilistic surrogate modeling (Gaussian Processes / TPE) |
Suboptimal model configurations, slow grid searching |
XGBoost, LightGBM, and Deep Neural Network parameter tuning |
|
Statistical A/B Testing |
Two-sample hypothesis testing (t-test / z-test / Chi-Square) |
Disentangling true causal impact from random sample noise |
Product feature rollouts, recommendation engine evaluation |
1. Feature Engineering & Dimensionality Reduction
Raw data rarely enters a model in an optimal numerical format. Feature engineering transforms input variables into meaningful signals that maximize an algorithm's predictive capability.
-
Continuous Scaling & Normalization: Implementing StandardScaler (Z-score normalization) or MinMaxScaler to ensure gradient descent steps converge uniformly across features with vastly different numerical ranges.
-
High-Cardinality Categorical Encoding: Replacing raw string categories with target encoding, weight of evidence (WoE), or frequency encoding to avoid the memory explosion caused by standard one-hot encoding.
-
Dimensionality Reduction via PCA: Decomposing correlated feature spaces into a smaller set of uncorrelated principal components that retain the vast majority of original variance without retaining collinear noise.
Applying these feature transformation techniques reduces computational overhead during training while preventing redundant variables from distorting model convergence.
2. Regularization Strategies to Prevent Overfitting
Complex models frequently memorize statistical noise within training datasets rather than learning underlying generalizable patterns. Regularization techniques constrain coefficient growth to maintain model stability.
-
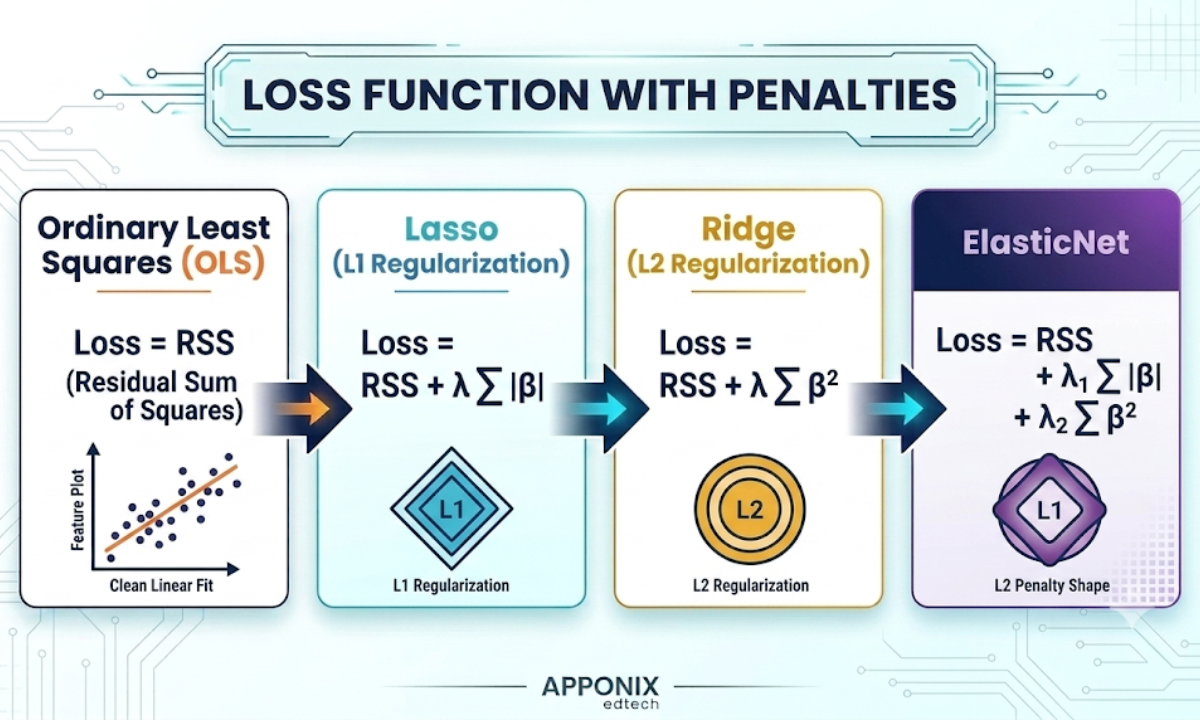
Lasso Regularization (L1 Penalty): Adds an absolute magnitude penalty (λ ∑ |β_j|) to the loss function. By driving less informative coefficients to zero, L1 acts as an automated feature selector for sparse datasets.
-
Ridge Regularization (L2 Penalty): Adds a squared magnitude penalty (λ ∑ β_j²) to the loss function. This shrinks correlated feature weights proportionally toward zero, preventing extreme coefficient swings caused by severe multicollinearity.
-
ElasticNet Optimization: Combines both L1 and L2 penalties with a balancing parameter, providing an effective solution for datasets where the number of predictors exceeds the number of observations.
Selecting the appropriate regularization penalty stabilizes regression and classification algorithms, ensuring that model predictions remain accurate across varying production distributions.
3. Hyperparameter Optimization & Model Calibration
Default model settings rarely yield optimal production performance. Advanced optimization techniques systematically navigate high-dimensional parameter spaces to maximize validation metrics.
-
Bayesian Optimization with Optuna: Replacing exhaustive grid search with sequential model-based optimization that directs exploration toward high-performing hyperparameter regions based on previous trial outcomes.
-
Probability Calibration (Platt Scaling & Isotonic Regression): Adjusting raw classifier probability outputs so that a predicted 80% confidence score matches an actual 80% empirical occurrence rate in production.
-
Early Stopping Mechanisms: Monitoring validation loss during gradient boosting and neural network training to halt iterations the moment generalization performance plateaus.
Adopting automated hyperparameter search frameworks saves hundreds of compute hours while preventing practitioners from deploying uncalibrated models.
4. A/B Testing & Statistical Inference in Production
Before rolling out an algorithmic update to millions of end users, organizations run randomized controlled trials (A/B tests) to confirm statistically significant business lift.
-
Hypothesis Formulation (H0 vs. H1): Establishing clear null and alternative hypotheses to evaluate whether a new model variant outperforms the baseline control.
-
Sample Size & Statistical Power Calculations: Determining the required sample size and minimum detectable effect (MDE) beforehand to maintain a standard 80% statistical power (1 - β) and avoid false negatives.
-
Controlling Type I Errors (α-Level): Enforcing strict significance thresholds (p < 0.05) to prevent rolling out changes driven purely by random sampling variations.
Executing robust statistical experiments protects enterprise systems from costly feature deployments, providing verifiable evidence of algorithmic return on investment.
Why Choose Apponix Technologies for Your Data Science Journey?
Transitioning from an aspiring analyst to an industry-ready data scientist requires moving beyond passive video tutorials and executing complete data lifecycles on complex, production-grade datasets. Apponix Technologies delivers an applied, mentor-led training model designed specifically to help learners master the entire data science toolchain.
Under the guidance of practicing enterprise data scientists and machine learning engineers, students transition from writing isolated Python scripts to deploying optimized machine learning pipelines and interactive executive dashboards.
-
Applied Real-World Capstone Datasets: Gain practical experience by cleaning, preprocessing, and modeling multi-gigabyte datasets sourced from banking fraud detection, retail demand forecasting, and healthcare telemetry domains.
-
1-on-1 Code Reviews from Industry Practitioners: Receive granular feedback on algorithmic selection, Scikit-learn pipeline design, and SQL query efficiency directly from senior data scientists working at leading tech enterprises.
-
Production Portfolio & GitHub Engineering: Transform classroom assignments into well-documented GitHub repositories complete with reproducible Jupyter notebooks, performance benchmark charts, and modular Python scripts that impress hiring managers.
-
End-to-End Analytics & BI Stack Mastery: Develop balanced expertise across the modern data spectrum, mastering statistical computing in Python, predictive modeling in Scikit-learn and TensorFlow, and visual analytics in Tableau and Power BI.
-
Dedicated Placement Support & Corporate Networking: Access direct hiring pipelines across Bengaluru's top technology parks, Global Capability Centers (GCCs), and high-growth analytics consulting firms, supported by targeted resume engineering and technical mock interviews.
Uniting rigorous hands-on lab environments with direct industry mentorship and verified portfolio creation, Apponix Technologies ensures you develop the practical competency required to excel across competitive data science and analytics roles.
Conclusion
Building a successful career in modern data science requires balancing software fluency with mathematical rigor. While learning the syntax of libraries like Pandas, Scikit-learn, and TensorFlow is necessary, true engineering value comes from understanding the underlying mechanics knowing when to regularize a model, how to evaluate predictions on imbalanced datasets, and how to translate complex statistical outcomes into clear commercial actions through Power BI or Tableau.
Achieving long-term career growth in this field involves consistent, hands-on experimentation across messy real-world datasets. As enterprise organizations continue to scale predictive analytics, automated machine learning pipelines, and generative AI systems, the demand for practitioners who can design reliable, bias-free, and high-performing models will remain strong.
Backing your technical capabilities with documented GitHub repositories, adhering to structured validation methodologies, and seeking experienced mentorship, you can confidently navigate the evolving analytics landscape and secure a high-impact role at the forefront of modern data science.
Reference:
https://www.geeksforgeeks.org/blogs/best-tools-and-technologies-for-data-science/
https://www.coursera.org/learn/open-source-tools-for-data-science

Apponix Academy
Apponix Academy