POPULAR COURSES
Master Programs


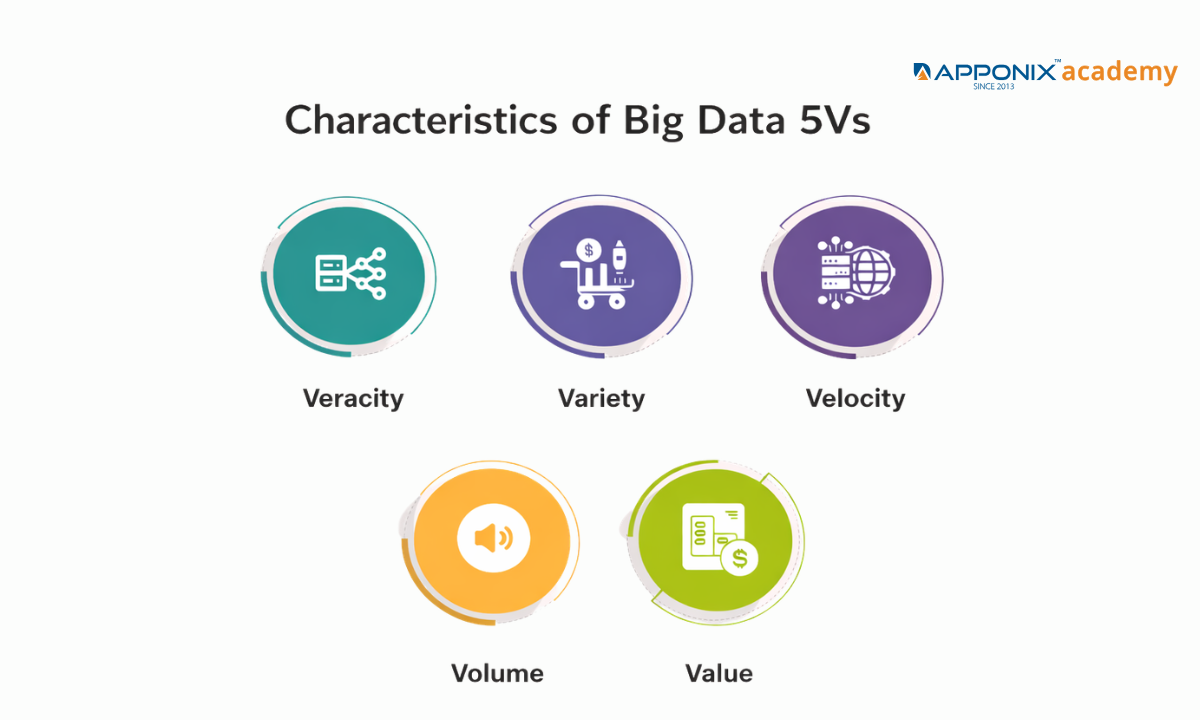
Table of contents:
|
1. The Scale of Enterprise Data |
|
2. The Speed of Streaming |
|
3. The Chaos of Unstructured Information |
|
4. The Accuracy Mandate |
|
5. The Ultimate Corporate ROI |
|
6. Conclusion |
The Old Model: Companies stored historical customer records on local office hard drives and reviewed them once a month.
The New Model: Corporations ingest millions of live, chaotic data points every single second and use algorithms to make instantaneous financial decisions.
If you are evaluating a Training institute in Bangalore today, you must realize that basic spreadsheet skills are completely obsolete.
To survive and thrive in this aggressive market, enrolling in an elite Data science course in Bangalore is your absolute first step toward mastering the actual lifeblood of the 2026 tech sector. However, before you write a single line of code, you must deeply understand the fundamental characteristics of big data 5Vs to even secure a technical interview.
Data is no longer just a digital filing cabinet. It is a high-velocity stream of global information that dictates supply chains, healthcare diagnostics, and stock market trades.
To transition your career from a theoretical student into a highly paid enterprise data architect, we must bypass the generic textbook definitions.
This clinical blueprint will map out the following exact corporate realities:
-
The sheer physical scale of modern data lakes and how global tech giants actually store this information.
-
The brutal processing speed is required to analyze live data streams without crashing the server infrastructure.
-
The mathematical necessity of filtering corrupted information to extract profitable business intelligence.
Let us completely decode the exact architectural framework that dictates how massive tech companies operate today.
The Scale of Enterprise Data
When we discuss the characteristics of big data 5vs, the most immediate and visible metric is absolute volume. A decade ago, a company considered a terabyte of data to be a massive storage burden.
Today, a single terabyte is essentially a rounding error for a modern tech corporation. We have officially moved past gigabytes and terabytes. The enterprise sector now operates strictly in petabytes and exabytes.
To truly grasp the magnitude of what processing big data entails at the corporate level, we must look at the mathematical reality of global platforms:
-
The Netflix Streaming Architecture: Netflix does not just store movie files. They store every single interaction from over 260 million global subscribers.
Every pause, rewind, and search query is recorded to feed their recommendation algorithm, resulting in dozens of petabytes of behavioral data stored across their data warehouses.
-
Amazon Web Services (AWS) Logs: Amazon processes millions of retail transactions daily, but AWS also hosts the infrastructure for millions of other companies.
The log files generated simply to monitor server health and security across their global data centers amount to exabytes of raw, continuous information.
-
Modern Autonomous Vehicles: A single self-driving car testing on the roads generates roughly four terabytes of sensor, camera, and GPS data every single day.
When an automotive company tests a fleet of one thousand cars, it must aggressively ingest and store four petabytes of physical data every single week.
This massive volume fundamentally breaks traditional databases. You cannot open an exabyte of data in a standard application without instantly crashing the system.
This is exactly why corporations are aggressively hiring engineers who know how to build distributed storage systems like Hadoop. When you distribute the massive weight of the data across thousands of connected machines, you transform a crippling storage problem into a highly searchable corporate asset.
The Speed of Streaming
In the modern enterprise, data is not static; it is kinetic. Velocity refers to the brutal, continuous speed at which new data is generated and the mathematical necessity to analyze it in real-time.
If a company is ingesting petabytes of information but takes 24 hours to generate a report, the intelligence is already dead. The financial markets and global supply chains shift in milliseconds, meaning that processing big data must happen the exact moment the data is created.
To understand why traditional IT infrastructure collapses under modern velocity, we must compare the outdated model of batch processing with the modern reality of live stream processing:
|
Processing Architecture |
Operational Mechanic |
Corporate Viability |
|
Traditional Batch Processing |
Data is collected over a period of time (e.g., 24 hours) and processed all at once during off-peak server hours. |
Completely obsolete for modern enterprise decisions. Useful only for historical payroll or end-of-month accounting. |
|
Real-Time Stream Processing |
Data is ingested, analyzed, and acted upon within milliseconds of generation using distributed clusters like Apache Kafka. |
The absolute non-negotiable standard for 2026. Required to maintain a competitive advantage in a live digital market. |
When you enroll in an elite data science program, you are not learning how to process historical CSV files. You are learning how to build the architecture that catches data while it is moving.
To comprehend the absolute necessity of this speed, look at how multinational corporations mathematically rely on velocity today:
-
High-Frequency Algorithmic Trading: Global hedge funds do not use human traders to read stock charts.
They deploy algorithms that ingest live global news feeds, social media sentiment, and market fluctuations to execute millions of micro-trades in a fraction of a second, entirely dependent on zero-latency data streams.
-
Live Credit Card Fraud Detection: When you swipe your card in a foreign country, the bank does not wait until tomorrow to verify the purchase.
A machine learning model processes your location data, purchase history, and device ID in under two seconds to either authorize the transaction or instantly freeze the account.
-
Predictive Healthcare Diagnostics: ICU life support systems continuously stream thousands of microscopic biometric data points per second.
Streaming architecture analyzes this velocity to detect a mathematically predicted heart failure minutes before the physical event actually occurs, alerting doctors instantly.
If your processing speed cannot match the velocity of the incoming data, your storage volume is completely useless.
The Chaos of Unstructured Information
The third 'V' destroys the traditional concept of a neat, orderly database. Historically, corporations only stored structured data: names, dates, and financial figures perfectly organized in rows and columns.
Today, this structured information accounts for less than 20% of the world's data. The remaining 80% is absolute chaos. Variety dictates the strict classification of big data, forcing enterprise architects to build completely new storage systems to handle information that simply does not fit into a standard spreadsheet.
To survive in a modern data science role, you must know how to extract financial value from three distinct categories of data simultaneously.
Here is the strict taxonomy of modern corporate information:
1. Structured Data (The Orderly Baseline)
-
The Format: Highly organized, quantitative data easily stored in traditional relational databases (SQL).
-
The Corporate Example: A global banking ledger containing exact transaction amounts, customer account numbers, and authorized timestamps.
-
The Reality: This is the easiest data to process, but because every company has it, it no longer provides a massive competitive advantage on its own.
2. Semi-Structured Data (The Bridge)
-
The Format: Information that lacks a strict, rigid database model but contains internal tags or markers to separate semantic elements (JSON, XML).
-
The Corporate Example: The raw server logs from an e-commerce platform tracking user clicks, or a massive batch of corporate emails containing sender, recipient, and subject metadata.
-
The Reality: This requires intermediate parsing skills and data engineering to clean and organize before predictive algorithms can actually analyze it.
3. Unstructured Data (The True Corporate Goldmine)
-
The Format: Massive, heavy files with zero internal organizational structure.
-
The Corporate Example: Millions of uploaded social media videos, live customer service audio recordings, satellite imagery of agricultural yields, and raw text from global news feeds.
-
The Reality: Traditional SQL databases completely fail here. You must deploy advanced NoSQL databases (like MongoDB) or massive Data Lakes, utilizing complex Natural Language Processing (NLP) and Computer Vision models to mathematically understand what this data actually means.
If an engineer only knows how to query a standard SQL table, they are functionally useless in a modern tech park.
The true value of a data scientist lies precisely in their ability to take chaotic, unstructured audio or video files and mathematically translate them into actionable corporate intelligence.
The Accuracy Mandate
The fourth 'V' represents the most dangerous trap in modern enterprise analytics. Having petabytes of data streaming into your servers in real-time is completely useless and actively dangerous if that information is corrupted. Veracity refers strictly to the accuracy, trustworthiness, and absolute quality of the data.
In the era of Artificial Intelligence, the old computing adage of "Garbage In, Garbage Out" has catastrophic financial implications. If a corporate machine learning model is trained on biased, incomplete, or bot-generated data, the algorithm will confidently execute massive financial mistakes at lightning speed.
To understand why data scientists spend up to 80% of their time strictly cleaning and verifying information, we must look at the brutal consequences of low veracity in the corporate sector:
|
Corporate Sector |
The Low-Veracity Threat (Corrupted Data) |
The High-Veracity Requirement (Clean Data) |
Financial / Operational Consequence of Failure |
|
Algorithmic Trading |
An AI ingests thousands of bot-generated, fake news tweets claiming a CEO resigned. |
The system cross-references social sentiment strictly with verified SEC filings and institutional financial reports. |
The algorithm triggers a massive, instantaneous stock sell-off, losing the hedge fund millions in seconds. |
|
Healthcare Diagnostics |
A wearable IoT heart monitor experiences a brief hardware glitch, sending a massive, false spike in heart rate data to the server. |
The data pipeline algorithmically identifies the spike as a hardware anomaly and smooths the data against historical patient baselines. |
A predictive model misdiagnoses a healthy patient with impending cardiac arrest, triggering a false, expensive medical emergency. |
|
Performance Marketing |
A server logs 100,000 clicks on a Google Ad campaign, but 95% of them are generated by a malicious competitor's botnet. |
Advanced analytics strip away known bot IP addresses and zero-second bounce rates to reveal the 5,000 actual human visitors. |
The marketing director allocates a ₹50,00,000 budget toward a completely fake audience, bleeding the company's capital dry. |
Filtering this noise is not a manual process; human beings cannot manually read petabytes of data. Top-tier data scientists are hired specifically to build automated filtration pipelines. To guarantee veracity, a modern data architect must deploy these specific engineering protocols:
-
Automated Anomaly Detection: Building statistical machine learning models that instantly flag and isolate data points that mathematically deviate from the established norm (e.g., a credit card being used in Bangalore and London within the same hour).
-
Data Lineage Tracking: Engineering a strict digital paper trail that tracks exactly where a piece of data originated, how it was modified, and who accessed it, ensuring absolute audit compliance for enterprise security.
-
Algorithmic Deduplication: Deploying scripts that instantly recognize and merge duplicate records streaming in from ten different global databases, preventing the AI from counting the same customer transaction multiple times.
Only when the data is mathematically verified as accurate can a corporation safely move to the final, and most important, characteristic of Big Data.
The Ultimate Corporate ROI
The final 'V' is the only metric the CEO and the board of directors actually care about. You must understand a brutal corporate reality: Volume, Velocity, Variety, and Veracity represent massive financial expenses.
Storing exabytes of clean, streaming data costs a corporation millions of dollars in monthly cloud server fees. If a company cannot extract actionable, profitable Value from this expensive infrastructure, the entire system is a catastrophic financial liability.
This is the exact intersection where data science and big data collide. The data engineer builds the expensive pipeline, but the data scientist is the one who refines the raw oil into actual corporate revenue.
To understand how top-tier tech companies mathematically justify their server costs, we must look at the exact ROI extraction pipeline:
Phase 1: The Infrastructure Cost A global logistics company ingests 50 million GPS pings from their delivery trucks daily (Volume & Variety), tracking them in real time (Velocity), and using algorithms to filter out dead zones and sensor glitches (Veracity). At this stage, the company is only spending money.
Phase 2: The Data Science Application: The data scientist steps in. They deploy a machine learning model over this massive, clean dataset to identify hidden patterns that human managers cannot see.
Phase 3: The Ultimate Value (ROI): The algorithm mathematically proves that rerouting trucks to avoid three specific intersections during a 15-minute window will reduce fleet idling time by 4%. That 4% reduction instantly saves the corporation ₹8,00,000 per month in diesel fuel costs. That is the definition of Value.
If your analysis does not result in a direct increase in revenue, a decrease in operational costs, or a massive mitigation of corporate risk, your Big Data strategy has failed.
Conclusion
To extract this level of corporate value, you cannot rely on academic textbooks. You must align yourself with a training ecosystem that strictly mirrors a live enterprise data center. Apponix Academy operates as a direct data architecture pipeline, enforcing the exact deployment advantages required to secure a top-tier job:
-
Live Cluster Deployment: We completely ban local desktop spreadsheets. Our curriculum forces you to deploy massive queries on live Hadoop and Apache Spark clusters to simulate real corporate server loads.
-
Python Architecture: You will not just organize data. You will write the exact Python algorithms used by Bangalore tech parks to extract financial Value from highly chaotic, unstructured datasets.
-
Corporate Portfolio Evidence: You will graduate with a live GitHub repository containing functioning enterprise data pipelines, completely removing the hiring risk for senior technical recruiters.
The modern enterprise does not hire candidates who only know the textbook definitions of Big Data.
They aggressively hunt for architects who can mathematically transform data chaos into undeniable corporate revenue. Stop studying isolated, clean datasets. Enroll in a true deployment engine with Apponix Academy today and secure your placement on the digital frontline.

Apponix Academy
Apponix Academy