POPULAR COURSES
Master Programs


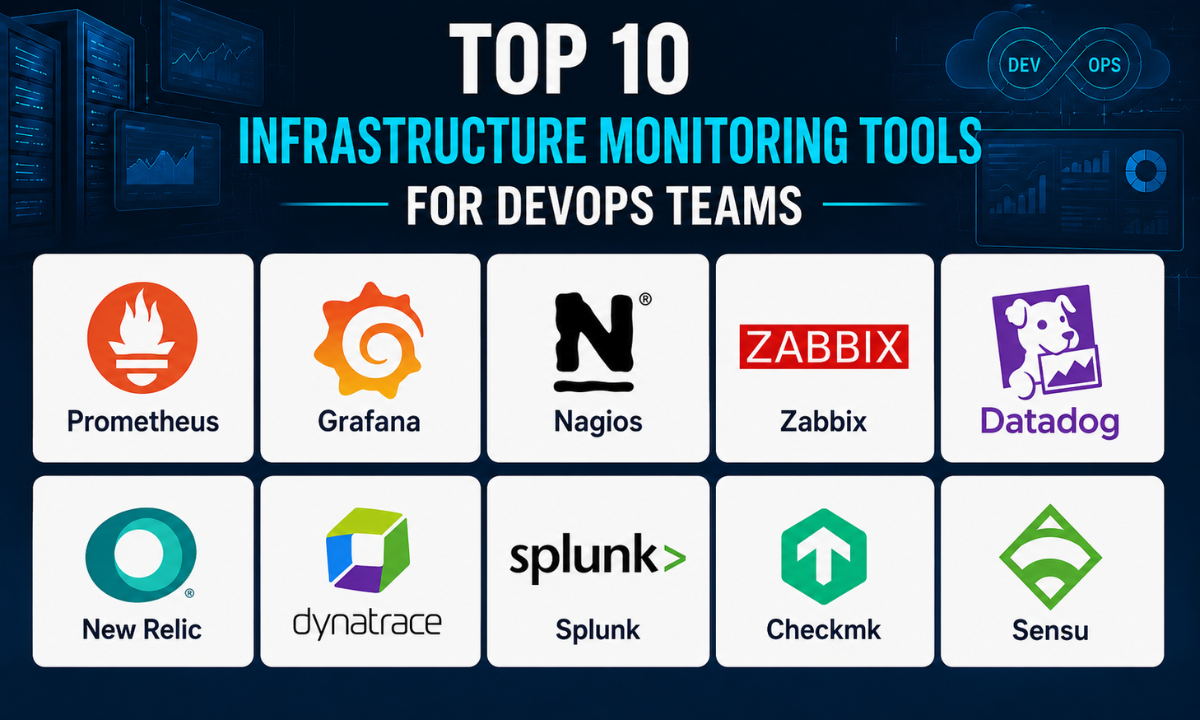
Table of contents:
|
1. Open Source Titans of Monitoring
|
|
2. Cloud Native and Enterprise Observability
|
|
3. Log Management and Advanced Analytics
|
|
4. Why Choose Apponix? Master DevOps Infrastructure with Apponix Technologies |
|
5. Conclusion |
Imagine an incredibly popular e-commerce platform launching its biggest annual sale, only for the entire payment gateway to crash silently under the sudden traffic spike. By the time the engineering team finally realizes there is a problem, millions of dollars in revenue have already been lost, and countless angry customers have abandoned their shopping carts. This catastrophic scenario is exactly why maintaining continuous system uptime is the absolute core responsibility of any modern engineering team.
In the Indian digital economy, simply writing good code is no longer enough. You must have the ability to identify hidden system bottlenecks, track server health, and proactively resolve database memory leaks long before they ever manage to crash your live application.
This critical requirement is precisely why infrastructure monitoring tools have become the absolute lifeline of modern software operations.
These platforms act as the central nervous system of your entire tech stack, providing engineers with real-time visibility into every single server, container, and microservice running in production. They automatically detect anomalies and instantly alert the right team members before a minor glitch cascades into a massive global outage.
Understanding how to deploy and configure these observability pipelines is not just a secondary skill; it is fundamentally required for anyone looking to enter the cloud computing industry. In fact, mastering these diagnostic platforms is always the very first practical step for professionals enrolling in a comprehensive DevOps course in Bangalore.
Let us dive into the top ten observability platforms that elite engineering teams use to keep their massive global architectures running flawlessly twenty-four hours a day.
Open Source Titans of Monitoring
Before exploring expensive paid enterprise platforms, every developer must understand the open source tools that established the absolute foundation of system reliability. These four titans handle everything from traditional server infrastructure to modern containerized microservices, making them the default starting point for system monitoring Linux environments.
1. Prometheus
Prometheus is the undisputed king of cloud native metric collection and is widely considered the absolute standard for monitoring Kubernetes environments. Originally developed by SoundCloud, it operates on a highly efficient pull model that actively scrapes time series data from your connected applications and stores it locally for incredibly fast querying.
Its primary relevance lies in its native integration with the modern cloud ecosystem and its powerful query language, PromQL, which allows engineers to build highly complex alerting rules based on multidimensional data. Rather than relying on legacy agent installations, Prometheus directly reads exposed metrics, making it incredibly lightweight and perfect for auto-scaling microservices. While enterprise alternatives like Datadog offer fully managed cloud experiences, Prometheus remains completely free and endlessly customizable for teams willing to manage their own local infrastructure.
2. Grafana
While Prometheus is exceptional at gathering and storing massive amounts of data, it is not designed to display that data beautifully. Grafana perfectly fills this gap as the ultimate open source visualization dashboard, allowing engineers to transform raw server metrics into stunning, highly readable graphical interfaces.
Grafana is rarely used in isolation. It is almost always paired directly with Prometheus to create a complete observability stack, though it natively supports dozens of other data sources, including Elasticsearch, InfluxDB, and MySQL.
The relevance of Grafana is its ability to create a single unified pane of glass where DevOps teams can track application response times, server CPU loads, and active database queries all on one single monitor. Its main competitors in the visualization space are enterprise tools like Kibana and Splunk, but Grafana remains the community favorite due to its massive library of pre-built, completely free community dashboards.
3. Nagios
If Prometheus is the modern king of cloud containers, Nagios is the respected veteran of traditional on-premises server alerting. Launched over twenty years ago, it remains one of the most reliable and deeply trusted open source monitoring tools in the entire IT industry.
Nagios specializes in tracking the health of physical network switches, legacy databases, and traditional bare metal Linux servers. It uses a highly established plugin architecture, meaning there are literally thousands of community-built scripts available to monitor virtually any hardware component you can imagine. While its user interface feels significantly more dated than modern cloud native platforms, its pure reliability and low resource consumption make it a permanent fixture in enterprise data centers. It competes directly with tools like Zabbix, but many older tech corporations refuse to transition away from Nagios simply because it never fails to deliver critical server alerts.
4. Zabbix
Zabbix bridges the gap between traditional on-premises monitoring and modern cloud architecture, offering a heavy-duty, enterprise-grade open source platform built specifically for massive network scalability. Unlike Nagios, which requires heavy manual configuration via text files, Zabbix provides a fully featured web GUI that makes managing thousands of servers significantly easier.
The incredible relevance of Zabbix is its ability to monitor millions of metrics entirely out of the box without requiring expensive commercial licenses. It acts as a single centralized server that collects data from remote proxies, making it perfect for multinational corporations managing data centers across completely different geographic regions. It directly competes with both Nagios and paid platforms like SolarWinds, offering distributed monitoring, automated network discovery, and highly customizable alerting pipelines completely free of charge.
Cloud Native and Enterprise Observability
As organizations transition from managing their own servers to running thousands of globally distributed microservices, managing open source diagnostic tools internally often becomes a massive administrative burden. This is exactly where fully managed enterprise Software as a Service platforms take over. These three tools represent the absolute pinnacle of application performance monitoring, providing deep automated observability without requiring any local infrastructure maintenance.
5. Datadog
Datadog is widely considered the absolute market leader in all-in-one cloud monitoring and automated tracing. It provides a completely unified platform where DevOps engineers can monitor their database queries, frontend user experiences, and backend Kubernetes clusters all on a single unified dashboard without ever switching tools.
The true relevance of Datadog is its incredible ease of use and its massive library of over six hundred out-of-the-box integrations.
You can literally install the Datadog agent on a server, and within minutes, the platform will automatically detect and begin monitoring the specific technologies running on that machine. Its primary competitors include New Relic and Dynatrace, but Datadog frequently wins out for rapidly growing startups and mid-sized enterprises because its visualization interface is incredibly intuitive for both junior developers and senior architects alike.
6. New Relic
New Relic is one of the original pioneers of deep application performance monitoring and remains a massive powerhouse in the observability sector. While it tracks traditional server metrics perfectly, its absolute core strength lies in its ability to trace complex software code execution down to the exact line of code causing a system bottleneck.
The most critical relevance of New Relic is how it approaches the different types of monitoring tools, specifically focusing heavily on the end-user experience. If a customer clicks a button on your website and the page loads slowly, New Relic can instantly trace that exact delay back through the browser, into the backend microservice, and straight down to the specific slow database query that caused the issue.
New Relic recently shifted to a highly aggressive consumption-based pricing model, making it a very strong competitor against Datadog for engineering teams that want strictly unified data pricing rather than paying per individual server host.
7. Dynatrace
If Datadog is built for agility, Dynatrace is built for absolute enterprise scale automation. This platform is heavily favored by massive multinational banks, global airlines, and healthcare corporations that run incredibly complex hybrid architectures spanning both legacy mainframes and modern cloud environments.
The incredible relevance of Dynatrace is its proprietary artificial intelligence engine called Davis. Unlike other platforms that simply send you an alert when a CPU spikes, the Dynatrace AI automatically analyzes billions of dependencies across your entire network and provides the exact root cause of the problem without requiring any human investigation. It directly competes with Cisco AppDynamics and New Relic at the highest enterprise tier.
While it requires a very significant financial investment, massive organizations gladly pay the premium because its automated AI root cause analysis drastically reduces the agonizing hours spent troubleshooting critical global outages.
Log Management and Advanced Analytics
While metrics and application traces are crucial for identifying that a system is failing, server logs are the exact diagnostic records you need to figure out why the failure happened in the first place. These final three tools specialize in chewing through massive amounts of machine-generated log data, providing the ultimate server infrastructure monitoring capabilities required to track down deeply hidden errors and security breaches.
8. Splunk
Splunk is the absolute giant in the world of searching, analyzing, and visualizing vast amounts of machine-generated data. It does not just monitor server health; it acts as a massive data engine that ingests everything from firewall security logs to custom application error messages, indexing all of it in real time for lightning-fast searching.
The true relevance of Splunk lies in its powerful Search Processing Language. When a server crashes mysteriously, engineers can use Splunk to instantly query millions of log entries from the exact millisecond of the crash to find the exact error code.
As Splunk handles both IT operations and high-level security event management, it is heavily used by massive enterprise security teams. Its primary competitors are the ELK Stack (Elasticsearch, Logstash, Kibana) and Datadog, but Splunk continues to dominate large enterprise environments due to its unmatched log processing speed and advanced security analytics.
9. Checkmk
Checkmk is a highly efficient IT infrastructure monitoring platform that bridges the gap between powerful log analysis and traditional server metrics. It is heavily utilized in strict corporate environments because it offers incredible out-of-the-box automation and automatically discovers every single host and service running across your entire network architecture.
The core relevance of Checkmk is its incredibly low CPU overhead and resource efficiency compared to heavier Java-based monitoring applications. It excels at consolidating all your server metrics, application states, and hardware logs into one highly structured, centralized dashboard.
As Checkmk supports over two thousand pre-built integrations, teams can monitor their cloud workloads and physical data centers simultaneously without writing custom scripts. It competes closely with Zabbix and Nagios, but Checkmk is often preferred for its drastically simplified web interface and superior automated mass agent rollouts.
10. Sensu
Sensu is an incredibly flexible, event-driven observability pipeline designed specifically for highly dynamic, auto-scaling cloud environments. Unlike traditional tools that strictly pull data on a fixed schedule, Sensu operates on a publish-subscribe model, allowing servers to instantly broadcast their health status and log events the moment an anomaly actually occurs.
The incredible relevance of Sensu is its monitoring-as-code approach. Engineers can define all their monitoring rules and log checks using declarative configuration files, meaning they can version control their alerting pipelines exactly like they version control their application code. This makes it completely indispensable for modern DevOps teams running constantly shifting Kubernetes clusters where servers are destroyed and recreated every few minutes.
While it integrates with and sometimes replaces older tools like Nagios, its true competitors in the modern pipeline space are cloud native solutions like Prometheus, though Sensu offers significantly better native consolidation of both logs and metrics in one single pipeline.
Why Choose Apponix? Master DevOps Infrastructure with Apponix Technologies
Memorizing the names of different observability platforms from an online article will never properly prepare you for a real engineering role. When a live production server crashes at two in the morning, you need the absolute technical confidence to navigate complex log files, identify the root cause, and deploy a fix immediately. This high level of practical troubleshooting simply cannot be learned through theoretical textbooks. It requires rigorous, hands-on experience building actual alerting pipelines on real cloud servers, which is exactly why our training approach is so incredibly effective.
As the leading Training institute in Bangalore, Apponix Technologies has designed a curriculum that strictly mirrors the daily realities of a modern Site Reliability Engineer. Here is exactly how we transform absolute beginners into highly capable DevOps professionals
-
Real World Cloud Deployment: You will not just watch videos. You will actively build, deploy, and monitor containerized applications on live AWS and Azure servers, creating the same observability dashboards used by enterprise tech teams.
-
Industry Expert Instructors: Every single training module is led by active senior engineers who bring a minimum of six years of corporate experience directly into the classroom environment.
-
100% Practical Learning: We intentionally introduce complex server errors and network bottlenecks into your training projects so you can practice using tools like Prometheus and Grafana to resolve them under realistic pressure.
-
Unmatched Placement Support: Beyond the technical training, we provide completely personalized resume building, mock technical interviews, and guaranteed placement assistance to ensure you smoothly transition into a high-paying role.
Forcing you to work directly with the same tools that global tech companies rely on every single day, we ensure you graduate with a highly competitive portfolio that strict hiring managers instantly recognize and respect.
Conclusion
Infrastructure monitoring is the absolute universal requirement of the modern technology sector. Whether a company is building dynamic web applications, architecting massive cloud environments, or running complex machine learning algorithms, it absolutely must know exactly what is happening inside its servers at all times.
Mastering these ten critical observability solutions gives you the fundamental architecture to collaborate with elite engineering teams across the globe without ever fearing that you might let a critical server crash go unnoticed. If you are serious about accelerating your technical skills and securing a high-paying role in system operations, it is time to move beyond basic beginner tutorials.
Contact Apponix today and enroll in our comprehensive DevOps course in Bangalore to start building your future-proof cloud computing career.

Apponix Academy
Apponix Academy