POPULAR COURSES
Master Programs


Table of contents
|
1. What does data analytics mean? |
|
2. Understanding data analytics types |
|
3. Essential data analytics tools |
|
4. Creating your data analytics roadmap |
|
5. Hands-on: Project examples & data analytics tools |
|
6. Planning for your data analytics certification |
|
7. Why choose a data analytics course in Bangalore? |
|
8. Tips to stay on track as a beginner |
|
9. Example: Customer Segmentation Mini-Project |
|
10. FAQs: Start-with-ease guide |
|
11. Wrapping it up |
Data analytics might seem complex at first, but once you understand its purpose, it’s like learning a language that businesses speak every day." We’ve guided many learners from confusion to clarity, and the transformation is inspiring.
At Apponix, we love helping beginners turn curiosity into clarity and careers through structured learning, real-world practice, and the right mindset.
In this guide, we’ll walk you through what data analytics means, the main types, the essential data analytics tools, a clear data analytics roadmap, options for data analytics certification, and insight into choosing a data analytics course in Bangalore, so you can craft your success path in this dynamic field.
1. What does data analytics mean?

Data analytics meaning is about using numbers and patterns to make smarter decisions.
We sift through data: customer clicks, sales numbers, survey responses to discover insights you can act on.
It’s a mix of curiosity, logic, and storytelling: transforming raw figures into strategic moves.
2. Understanding data analytics types
There are four key data analytics types:
|
Type |
Description |
Example |
|
Descriptive |
What happened? - summarizes past events |
“Sales rose 20% last quarter.” |
|
Diagnostic |
Why did it happen? - finds causes |
“Churn increased because website load time spiked.” |
|
Predictive |
What might happen? - uses models to forecast |
“We expect 15% more sales next quarter.” |
|
Prescriptive |
What should we do? - suggests actions |
“Offer a discount to retain 10% of at-risk customers.” |
We recommend starting with descriptive and diagnostic analytics; that foundation will ease you into predictive and prescriptive.
3. Essential data analytics tools
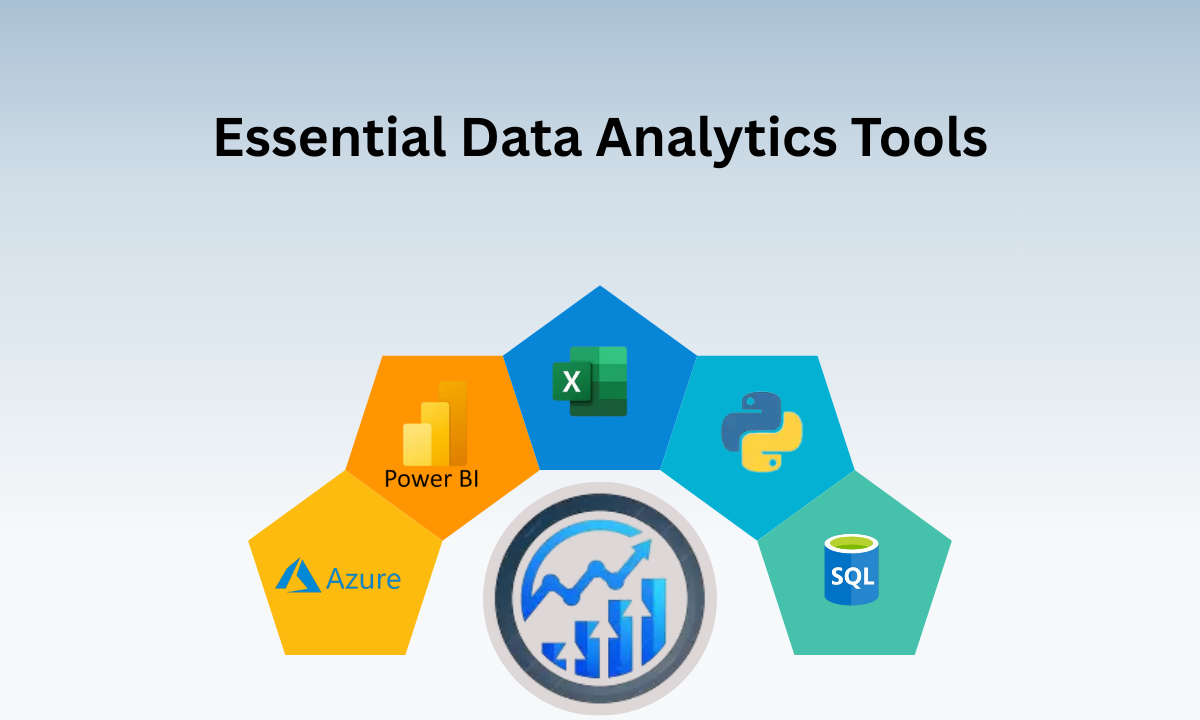
You will lean on tools to transform, analyze, and visualize data. Here’s what’s most common:
-
Excel & Google Sheets – perfect for quick analysis and pivot tables.
-
SQL – indispensable for querying databases.
-
Python (Pandas, NumPy, Matplotlib) – for robust data manipulation and data visualisation.
-
R (tidyverse, ggplot2) – especially useful for statistical analysis.
-
BI Tools – like Tableau, Power BI, or Looker, to create dashboards.
-
Cloud & Big-Data tools – AWS/Azure analytics, Spark, Hadoop as you scale.
Think of tools as your toolkit: start with a few, then expand as your career evolves.
4. Creating your data analytics roadmap
Here’s a simple, actionable data analytics roadmap to guide your growth:
-
Foundational literacy – understand what data analytics is, and learn Excel/SQL basics.
-
Tool mastery – practice Python or R, build charts, write queries.
-
Domain knowledge – pick an industry (finance, marketing, health) and explore real datasets.
-
Advanced analytics – dip into regression, clustering, and forecasting.
-
Visualisation & storytelling – build dashboards, derive insights, and present clearly.
-
Portfolio & practice – complete mini-projects, publish on GitHub or a blog.
-
Certification & specialization – pursue credentials that validate your skills.
Following this roadmap helps you move from zero to a confident data analyst.
5. Hands-on: Project examples & data analytics tools
Here are mini-project ideas to build your skillset:
-
Sales dashboard: Use Excel or Tableau to visualize monthly sales trends.
-
Customer segmentation: Clean a dataset in Python, run clustering, and identify groups.
-
Forecasting demand: Load historical data, use simple linear regression to predict next-month demand.
-
Website analytics: Use Google Analytics (or mock data) to identify high-bounce pages and suggest fixes.
Each of these projects teaches tool use, insight generation, and storytelling.
6. Planning for your data analytics certification
Certifications can boost credibility; here are popular choices:
|
Certification |
Focus |
Why It Helps |
|
Microsoft Certified: Data Analyst Associate (Power BI) |
BI and dashboarding |
Great for visualisation-heavy roles |
|
Google Data Analytics Professional Certificate |
End-to-end analytics pipeline |
Entry-level friendly, industry recognition |
|
IBM Data Analyst Professional Certificate |
Python, SQL, Excel, visualisation |
Broad practical skills |
|
Tableau, Power BI, or Looker certifications |
BI tools expertise |
Valuable for BI-focused roles |
Pick a certification that aligns with your tool preference and career goals; it’s a clear credential to showcase.
7. Why choose a data analytics course in Bangalore?
If you’re in or around Bangalore, exploring a data analytics course in Bangalore could give you excellent support.
-
The city is a tech education hub with high-quality training centers.
-
Many courses include live instruction, labs, and peer interaction.
-
Some offer placement assistance or interview prep immersion matters.
-
At Apponix, we’ve seen beginners gain momentum quickly through structured Bangalore-based programs.
Local learning bridges your knowledge with industry readiness.
8. Tips to stay on track as a beginner
Here’s what’s served many learners well:
-
Start with small projects, even just analyzing a personal budget.
-
Use free datasets (government, Kaggle) to practice.
-
Share your work - blogs, dashboards, or GitHub build visibility.
-
Join communities - forums, student groups, Slack channels to ask questions and stay motivated.
-
Pair learning with business questions, e.g., “Which product drives the most revenue?”, that bridges technique and insight.
Consistency + curiosity = growth.
9. Example: Customer Segmentation Mini-Project
Here’s a quick example to illustrate how to apply what you’ve learned:
-
Download a retail customer dataset.
-
Use Python (Pandas) to clean missing data.
-
Calculate RFM metrics (Recency, Frequency, Monetary).
-
Use clustering (e.g., K-Means) to segment customers.
-
Visualize segments using scatter plots or dashboards.
-
Summarize: “This high-value segment contributes 60% of revenue but is only 20% of customers; target with loyalty offers.”
This mini-project demonstrates data cleaning, analysis, segmentation, and storytelling, all in one.
10. FAQs: Start-with-ease guide
Q1: How long does it take to become job-ready in data analytics?
If you dedicate consistent time, say, 10–15 hours a week, you can become job-ready for entry-level roles in about 4–8 months. This includes learning core concepts, practicing with real datasets, and building a small but impressive portfolio. Of course, the more time you invest in hands-on projects, the faster your confidence and employability grow.
Q2: Do I need a degree in statistics or IT?
Not at all. While having a background in statistics, computer science, or IT can help, many successful data analysts start from completely different fields: business, economics, marketing, or even the arts. What matters most is your ability to learn the tools, understand data-driven thinking, and demonstrate skills through projects and case studies. Employers often value a strong portfolio over formal academic credentials.
Q3: Which tool should I learn first?
We recommend starting with Excel and SQL because they form the backbone of most data-related work. Excel helps you quickly analyze, clean, and visualize data, while SQL is essential for pulling data from databases. Once you’re comfortable with these, move on to Python (for advanced analysis and automation) or Tableau (for creating interactive dashboards). This layered approach keeps your learning structured and avoids overwhelm.
Q4: Is it possible to learn data analytics part-time while working?
Absolutely. Many learners begin their data analytics journey alongside a full-time job by dedicating evenings or weekends to study and practice. Online courses, flexible learning platforms, and self-paced projects make it easier than ever to learn at your own pace. The key is consistency; small, regular practice sessions often lead to better retention than cramming once in a while.
Q5: How valuable are certifications in data analytics?
Certifications can be very useful for structuring your learning and signaling to employers that you’ve mastered certain skills. They can also boost your resume and give you a sense of accomplishment. However, certifications alone aren’t enough; you will need to pair them with hands-on project work, internships, or freelance tasks to truly stand out in the job market. Think of certification as the map, and real-world practice as the actual journey.
11. Wrapping it up
Insert image:
A person raising hands in success with analytics charts in the background.
Here’s your clear path to launch a data analytics career:
-
Know data analytics meaning - turn data into insights.
-
Understand data analytics types - from descriptive to prescriptive.
-
Master essential data analytics tools - start simple, then expand.
-
Follow a clear data analytics roadmap - step-by-step readiness.
-
Use real projects to build confidence and showcase your skills.
-
Choose a valuable data analytics certification to validate your growth.
-
If you’re nearby, a data analytics course in Bangalore can provide guidance, hands-on support, and motivation.
-
Stay consistent, curious, and community-engaged.
We’re cheering for you and your journey from curious to capable is just beginning. Apponix is here to guide, support, and celebrate your next milestone.
Happy analyzing!

Apponix Academy
Apponix Academy