POPULAR COURSES
Master Programs


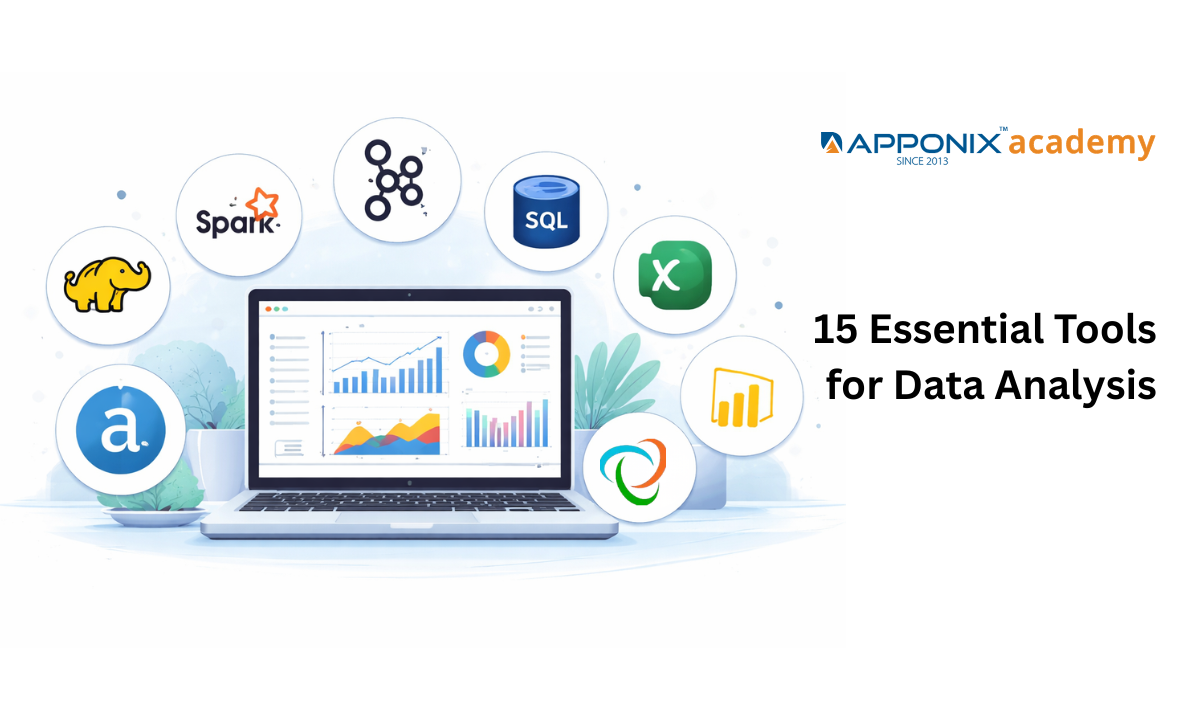
Table of contents:
|
1. The Foundation: Data Preparation and Cleaning |
|
2. Statistical Processing |
|
3. Data Visualization Architectures |
|
4. Tools for Big Data Analysis |
|
5. What Actually Gets You Hired? |
|
6. The Apponix Deployment Engine |
|
7. Conclusion and Next Steps |
Raw data is basically digital garbage.
Companies collect petabytes of customer information every single day. Sitting on this raw information does not print money.
You must extract the actual profit hiding inside those messy server logs.
Freshers walking into a Data analytics course in Bangalore usually ask the same question.
They want to know exactly which software guarantees a high-paying corporate job.
Choosing the right Training Institute in Bangalore is only your first step.
You must master the specific tools for data analysis that top Indian IT firms actually deploy on live servers.
Memorizing textbook definitions gets your resume rejected instantly.
Recruiters demand candidates who can clean, process, and visualize massive datasets without crashing the system.
We are going to dissect the complete software stack required to survive your technical interview.
Let us look at the exact arsenal used by working professionals to turn chaotic numbers into a clear business strategy.
The Foundation: Data Preparation and Cleaning
Garbage in guarantees garbage out.
You cannot run advanced predictive models on broken spreadsheets. Real corporate data is extremely messy.
It contains missing values, wrong date formats, and duplicate customer profiles. Handling this chaos is called Data cleaning.
Freshers often hate this phase.
Industry veterans know it consumes exactly eighty percent of their daily working hours.
Before you can visualize anything, you must scrub the raw numbers.
Let us look at the top foundational tools used for this dirty work:
-
Microsoft Excel: The absolute undisputed king of basic tabular data. You must master VLOOKUP, INDEX MATCH, and complex pivot tables before touching any heavy coding language.
-
Alteryx: A massive enterprise automation engine. It allows analysts to blend millions of rows from different servers without writing a single line of SQL code.
-
Trifacta: Visualizing the mess makes it easier to fix. This software uses machine learning to suggest exact formatting corrections during heavy Data preparation cycles.
Skipping these foundational tools is career suicide.
Your manager will instantly reject a beautiful dashboard if the underlying dataset contains blank rows and duplicate transaction IDs.
Mastering this scrubbing phase builds the exact structural integrity required for all future statistical testing.
Statistical Processing
Excel crashes when you feed it ten million rows.
You cannot click your way through massive corporate datasets.
You need heavy engines that follow precise written instructions.
This is where statistical programming takes over the heavy lifting from manual spreadsheets.
These platforms build the complex predictive models used by Indian banks to detect UPI fraud in milliseconds.
They move beyond simple historical reporting into forecasting future trends using machine learning algorithms.
Let us clinically compare the three main engines powering modern analytics:
|
Feature |
Python |
R |
SAS |
|
Primary Focus |
General-purpose programming and machine learning production pipelines. |
Pure statistical analysis and heavy academic research visualization. |
Legacy corporate analytics is strictly in the banking and pharmaceutical sectors. |
|
Cost Structure |
Open source tools for data analysis (Free). |
Open source tools for data analysis (Free). |
Extremely expensive annual corporate licensing fees. |
|
Learning Curve |
Moderate. Readability is high for beginners. |
Steep. Syntax is complex for non-statisticians. |
Moderate. Requires specific proprietary training. |
The Bangalore IT market currently heavily favors Python.
It is free, highly flexible, and integrates easily with live web applications.
R remains dominant in specific academic research sectors.
SAS is still king in older banking systems, but its massive cost is slowly pushing companies toward powerful open-source alternatives.
Mastering at least one of these engines is absolutely mandatory for a serious career.
Data Visualization Architectures
CEOs do not read spreadsheets. They simply do not have the time.
When you present five million rows of regional sales data to a managing director in Koramangala, they demand instant clarity.
This is the exact biological function of Data visualization.
It translates aggressive mathematical models into interactive, color-coded business intelligence.
You are painting a financial picture using live server data.
Let us examine the top three visualization engines dominating Indian corporate boardrooms right now:
-
Microsoft Power BI: Microsoft built an absolute corporate monster.
It integrates flawlessly with the existing Office 365 ecosystem and Azure cloud servers.
Writing complex DAX formulas allows analysts to manipulate live data directly inside the visual canvas.
-
Tableau: This is the undisputed champion for pure visual aesthetics.
It handles massive data lakes effortlessly and renders incredibly smooth, interactive geographical maps. Indian e-commerce giants rely heavily on Tableau for tracking live delivery metrics across tier-2 cities.
-
Qlik Sense: Built for pure associative exploration. Its unique in-memory engine automatically maps hidden relationships between data points.
This allows non-technical managers to click through charts and drill down into the metrics without writing a single database query.
Mastering these visual architectures is absolutely non-negotiable.
A brilliant Python machine learning script is entirely useless if the board of directors cannot understand the final output.
Your corporate salary depends directly on your ability to build interactive dashboards that tell a compelling, profitable story.
Tools for Big Data Analysis
Regular databases choke on video files.
A standard SQL server simply dies when you feed it ten terabytes of raw social media clicks. When information becomes too massive and too chaotic, we enter a completely different arena.
Indian telecom giants and streaming apps cannot rely on Excel or simple Python scripts.
They require industrial tools for big data analysis to survive the daily load.
Let us inspect the heavy machinery running behind the scenes:
-
Apache Hadoop: This framework distributes massive files across thousands of cheap computers. It does not process fast. It stores infinitely.
-
Apache Spark: Speed is its only religion. It processes data directly inside the system RAM.
This makes it a hundred times faster than Hadoop for running live machine learning tasks.
-
Apache Kafka: This platform handles a continuous tsunami of live information.
Apps like Swiggy use this exact architecture to track a million delivery partners moving simultaneously across Bangalore traffic.
-
Splunk: Think of it as a relentless search engine for raw machine data. It reads messy server logs to detect active cybersecurity threats instantly.
-
Talend: This tool automates the heavy plumbing. It safely extracts data from older local servers and moves it securely into a modern cloud warehouse.
Managing these platforms requires dedicated engineering teams. You do not install Spark on a standard college laptop.
These are heavy industrial engines designed specifically to prevent catastrophic server crashes during massive Indian festival sales.
What Actually Gets You Hired?
Companies do not hire software collectors. They hire executioners.
Looking at a list of fifteen complex platforms creates massive anxiety for any fresher. You absolutely do not need to master every single tool to secure your first corporate paycheck in a Bangalore tech park.
You only need the mandatory baseline.
When technical recruiters screen resumes for the exact tools used by data analyst, they strictly hunt for a specific survival kit.
Let us aggressively filter this massive list down to the absolute non-negotiable software stack:
-
Structured Query Language (SQL): The absolute gatekeeper.
You must write flawless queries to extract raw rows directly from heavy relational databases.
-
Microsoft Excel: The daily battleground. Quick pivot tables and complex index matching handle rapid management requests instantly.
-
Python: The heavy artillery.
You deploy Pandas and NumPy libraries specifically when standard spreadsheets crash under millions of data points.
-
Power BI or Tableau: The translation layer. You must build interactive visual dashboards to explain mathematical models to non-technical directors.
Missing any one of these core pillars guarantees immediate rejection during live technical interviews.
The modern Indian IT industry aggressively demands candidates who can pull raw numbers with SQL, clean the mess in Excel, and present it flawlessly in a Power BI board meeting before lunch.
The Apponix Deployment Engine
Theory pays absolutely nothing in the Bangalore IT corridor.
Corporate recruiters completely ignore textbook analysts.
They demand candidates who can clean a corrupted SQL database and deploy a Power BI dashboard before lunch.
This brutal market reality dictates exactly why Apponix Academy built a specialized deployment engine specifically for freshers.
We refuse to teach you useless, outdated software just to fill a syllabus.
We actively rewire your brain to process massive datasets like a senior corporate analyst facing a live production deadline.
Let us clinically dissect the exact infrastructure that separates our students from standard college graduates:
-
MNC Veteran Instructors: Active data scientists from top tech parks aggressively review your Python syntax to eliminate poor logic before it becomes a habit.
-
Live Server Infrastructure: Scrubbing heavy datasets happens on our active servers to prevent your personal laptop from freezing during complex SQL joins.
-
Dedicated Placement Pipeline: Scheduling guaranteed corporate technical interviews secures your transition directly from the classroom to the Bangalore production floor.
Relying on this rigid corporate training environment forces your resume past automated HR filters.
You walk into your first technical interview having already built the exact predictive models the company desperately needs to survive.
Conclusion and Next Steps
Time is bleeding. The Bangalore IT sector does not wait for hesitant candidates.
Watching another free Python tutorial will not magically compile a lucrative corporate career.
You possess the exact software blueprint required to transition from a complete novice into a highly paid data analyst. The roadmap is completely useless without immediate execution.
Your future salary depends entirely on the analytical models you deploy today.
-
Stop the Guesswork: Abandon scattered video playlists that teach outdated statistical syntax and broken data manipulation techniques.
-
Demand Elite Infrastructure: Secure your seat in a curriculum designed explicitly for immediate corporate deployment.
-
Book the Technical Audit: Schedule a free demo session at Apponix Academy to inspect our data labs and speak directly with active IT leads.
Executing these exact steps guarantees your resume bypasses automated HR algorithms and lands directly on a senior recruiter's desk.
Stop calculating the risks of learning and start securing your corporate placement through brutal, hands-on server execution.

Apponix Academy
Apponix Academy