POPULAR COURSES
Master Programs



Table of contents:
|
1. The Architectural Foundation of DORA |
|
2. Breaking Down the 4 Key Metrics
|
|
3. Transitioning to a Data-Driven Engineering Loop
|
|
4. Why Choose Us? Master Production-Grade DevOps |
|
5. Conclusion |
Velocity without stability is a recipe for catastrophic downtime. Measuring engineering productivity by raw lines of code or the sheer volume of feature requests completed is an obsolete practice.
To gauge true operational health, elite tech organizations rely on standardized, data-driven frameworks. Implementing DORA metrics has become the gold standard for quantifying delivery velocity and systemic stability. Bridging this operational alignment gap is precisely why our premier DevOps course in Bangalore focuses on teaching architectural governance rather than simple tool execution.
To lead high-performing engineering teams, you must move past vanity metrics and embrace automated, value-stream telemetry.
The Architectural Foundation of DORA

To master high-leverage cloud infrastructure, one must first answer a fundamental question: What are DORA metrics exactly? Formulated by Google Cloud’s DevOps Research and Assessment team after evaluating thousands of engineering organizations globally, this framework isolates the precise indicators that separate low-performing software teams from elite architectures.
Integrating DORA metrics with DevOps models allows engineering leaders to stop relying on subjective gut feelings and start measuring actual engineering throughput and stability across four distinct vectors.
These metrics are divided evenly into two balanced dimensions: Velocity (how fast you deliver value) and Stability (how safely that value operates in production).
The Elite Performance Matrix
|
Metric |
Measurement Dimension |
Elite Performer Benchmark |
Core Strategic Focus |
|
Deployment Frequency |
Throughput (Velocity) |
Multiple times per day |
Minimizing batch size, accelerating feedback loops |
|
Lead Time for Changes |
Throughput (Velocity) |
Less than one hour |
Eliminating review bottlenecks, automated CI |
|
Change Failure Rate |
Stability (Reliability) |
0% – 15% |
Robust automated unit testing, pre-deployment linting |
|
Time to Restore Service |
Stability (Reliability) |
Less than one hour |
Advanced observability, automated canary rollbacks |
Breaking Down the 4 Key Metrics
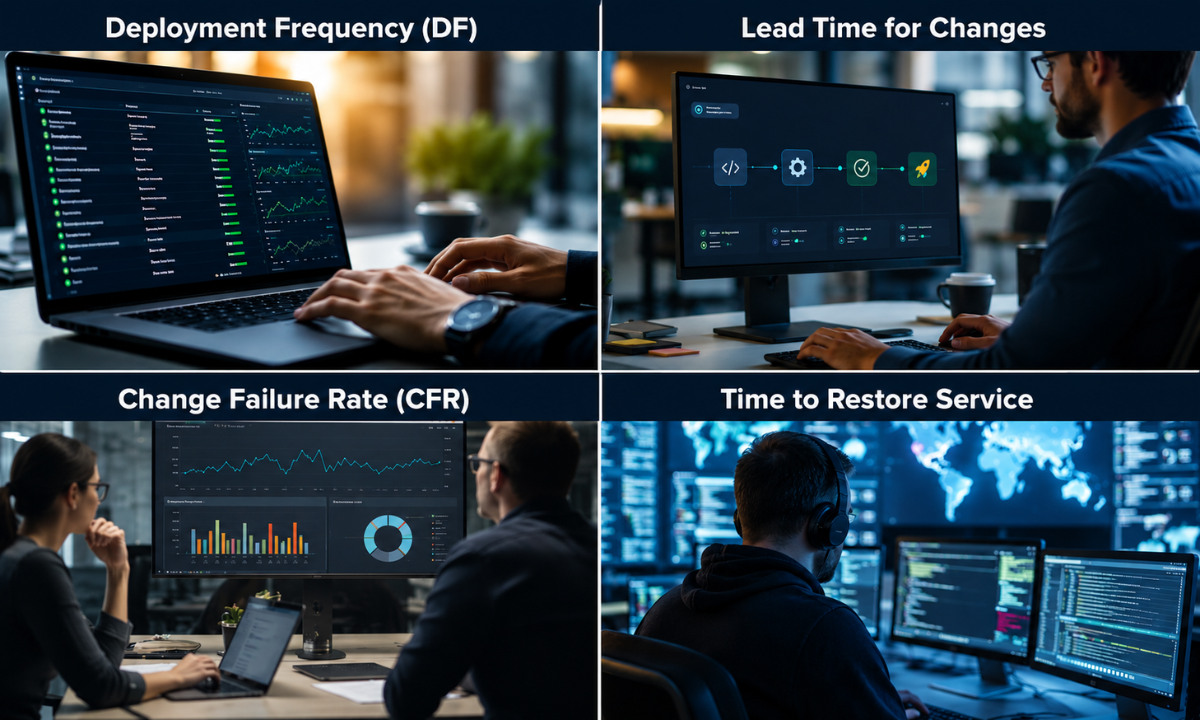
1. Deployment Frequency (DF)
This metric tracks how often your organization successfully releases code to a production environment.
Elite teams don't batch their changes into massive, high-risk quarterly releases. Instead, they work in highly optimized, single-piece flows. By deploying multiple times a day, each change represents a minor, contained update. If a failure does occur, isolating the breaking change is incredibly simple because the delta between the previous state and the current state is microscopic.
2. Lead Time for Changes
This measures the exact elapsed time from when a developer commits a line of code to the moment that same code runs successfully in the live production environment. A prolonged lead time points directly to organizational friction, such as slow manual code reviews, tedious QA sign-offs, or outdated change approval boards.
Elite engineering cultures eliminate these bottlenecks by automating their verification steps, successfully minimizing the overall delivery time from a developer's local branch to the customer.
3. Change Failure Rate (CFR)
Velocity is completely meaningless if your software breaks immediately upon arrival. Change Failure Rate measures the percentage of deployments to production that result in a degraded state, service outage, or require immediate remediation (like a hotfix or rollback).
While AI code-generation tools have dramatically accelerated how fast software is written, they can cause a severe spike in CFR if teams abandon foundational testing practices. A low CFR proves your automated testing safety nets are successfully catching regressions before they impact users.
4. Time to Restore Service
When production failures inevitably occur, elite status is determined by your speed of response. Tracking the mean time to recovery (MTTR) establishes an objective baseline for how quickly your automated telemetry detects an incident, how rapidly your on-call SREs diagnose the root cause, and how efficiently your deployment mechanisms can roll back or fix the issue.
High performance here relies heavily on robust observability architectures and standardized, decoupled infrastructure patterns.
Transitioning to a Data-Driven Engineering Loop

Implementing a DORA framework requires an operational culture shift. You cannot accurately measure these metrics using manual spreadsheets or self-reported estimations; the entire pipeline must be programmatically instrumented.
1. Automate Telemetry Collection (Phase 1: System Instrumentation)
Integrate event-driven webhooks directly into your version control systems and CI/CD pipelines to log precise, immutable timestamps for every commit, build, and deployment.
2. Establish an Objective Baseline (Phase 2: Baseline Mapping)
Aggregate your automated pipeline and stability data over a continuous 30-day window to map your engineering team’s current performance tier without imposing premature quotas.
3. Balance Velocity and Stability (Phase 3: Target Bottlenecks)
Analyze the metrics delta. If throughput is exceptionally high but stability is dropping, pause feature delivery to fortify your automated testing safety nets and internal platform quality.
The Power Balance: Never look at a single DORA metric in isolation. If a team is pressured to solely optimize Deployment Frequency, they may cut corners on verification, causing a massive surge in the Change Failure Rate. True engineering excellence lies in balancing speed with stability.
Why Choose Us? Master Production-Grade DevOps
Understanding the theory behind DORA metrics will not help you optimize a broken enterprise architecture. To command elite engineering roles, you need the practical muscle memory of building automated pipelines, configuring continuous monitoring, and writing infrastructure code that actively drives down recovery times.
As a leading Training Institute in Bangalore, Apponix Technologies strips away generic, surface-level tutorials. Our advanced curriculum treats you like an active Systems Architect from day one:
-
Practitioner-Led Instruction: Learn directly from active Senior DevOps Consultants and SRE Directors who manage high-scale cloud platforms every day.
-
Production-Grade Infrastructure Labs: Spend your time configuring real-world CI/CD pipelines, container orchestration environments, and automated testing suites inside fully functional labs.
-
Rigorous Career Acceleration: We don't just provide certifications. Apponix delivers a comprehensive career ecosystem, complete with resume optimization, intensive mock technical interviews, and direct placement pipelines into top-tier tech enterprises.
Stop managing infrastructure by guesswork. Connect with Apponix Technologies, master the data-driven frameworks that govern modern cloud operations, and position yourself at the very top of the technology hierarchy.
Conclusion
At the end of the day, DORA metrics aren't just numbers on a dashboard—they are the literal blueprint of an elite engineering culture. The companies winning the tech race aren't the ones writing code the fastest; they're the ones who can deploy safely, recover instantly, and eliminate guesswork from their deployment pipelines.
Don't let your career get bogged down by outdated vanity metrics. Master the data-driven frameworks that power the world's most resilient cloud operations. Connect with Apponix Technologies today, bridge your execution gap, and start commanding your infrastructure like an elite DevOps leader.
Reference:
1. https://www.atlassian.com/devops/frameworks/dora-metrics
2. https://getdx.com/blog/dora-metrics/

Apponix Academy
Apponix Academy